![]()
Part One
CONSTRUCTING YOUR IVY PORTFOLIO
![]()
Chapter 1
The Super Endowments
16.62%.
That figure is the annualized return the Yale University endowment has returned per year between 1985 and 2008.1 To put that number into perspective, the S&P 500 Index returned 11.98% a year over the same time period in one of the greatest bull markets in U.S. history.
Not only did the Yale endowment outperform stocks by over 4% per year, but it did so with 33% less volatility and only one losing year (a measly—0.2% in 1988). Similarly, the Harvard University endowment returned over 15% a year with less than 10% volatility.2 When the S&P 500 declined by 30% from June 2000 to June 2003, the Yale endowment gained roughly 20% and the Harvard endowment returned 9%.
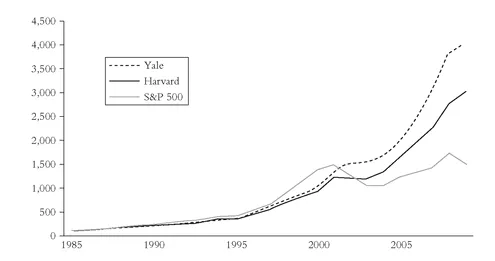
A $100,000 investment in the Yale endowment in 1985 would be worth $4.0 million by June 2008, versus only $1.5 million invested in the S&P 500 and $950,000 in U.S. 10-year government bonds. The same amount invested in the Harvard endowment would be worth a respectable $3.0 million.
Figure 1.1 Equity Curve of the Yale and Harvard Endowments vs. the S&P 500, 1985-2008, Fiscal Year Ending June 30th
SOURCE: Harvard and Yale endowment annual reports.
Figure 1.1 shows the performance of the top two endowments (by size) versus the S&P 500.
How exactly did Yale and Harvard accomplish such great returns, and more important, can an individual investor hope to achieve similar success? That is the focus of this book—a glimpse into the ivory tower to combine the best of academia and the real world to manage your portfolio.
Endowments Are Different
Effective management of a university endowment requires balancing fundamentally competing objectives. On the one hand, the university requires immediate proceeds to support the current generation of scholars. On the other hand, investment managers must consider the needs of generations to come.The endowment must be safeguarded so that it will survive as long as Yale itself, which we believe means forever.
—PRESIDENT RICHARD LEVIN, 2000 YALE ENDOWMENT REPORT
Endowments are a little different from the average investment portfolio. First of all, they don’t have to pay any taxes to the United States government. This enables the endowments to pursue asset classes and strategies that vary from taxable accounts since they do not have to make investment decisions based on considerations of long-term versus short-term capital gains.
Second, endowments have a long-term investment horizon: forever. They hope to exist in perpetuity, trying to treat future generations of students fairly and similarly to the current generation. To do so, endowments typically spend between 4% and 5% of their endowment every year to cover university operating costs.3 Because of this long-term horizon, endowments have an unrestricted investment policy and do not have the liquidity needs of a normal investor (buying a house, paying for a child’s college education, paying for medical bills, and so on). This allows endowments to invest in illiquid asset classes like timber that may require an investment time horizon of more than 20 years.
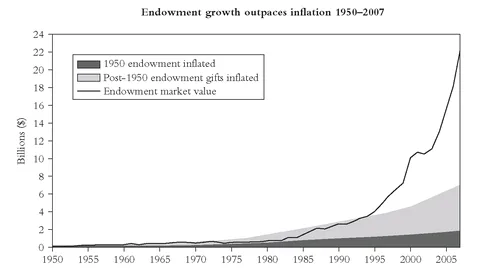
To keep the endowment from dwindling, the endowment manager aims for portfolio returns that outpace inflation (historically around 3% per year but it has been much higher) and university spending rates (4% to 5%). Inflation is the endowment’s worst enemy, and ideally an endowment would like its performance chart to look like Yale’s (see Figure 1.2), with the endowment’s growth handily outperforming the ravages of inflation over time. Returns before inflation are called nominal returns, while returns after inflation are called real returns.
Endowments are becoming increasingly important to the health of a university, and a sustainable endowment frees the university from relying on any single source of funding. Funds can be used to invest in new facilities, create and maintain academic posts, fund research, and create new scholarships.
Figure 1.2 Yale Endowment vs. Inflation, 1950-2007
SOURCE: Yale 2007 endowment report.
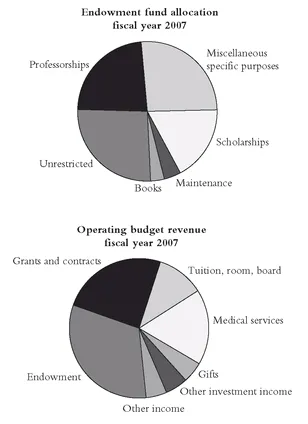
Figure 1.3 details an example of how the Yale endowment proceeds are spent.Yale endowment spending has grown from 12% of the operational budget in 1990 ($86 million) to 33% today ($684 million). If you think that is impressive, almost half of Princeton University’s operating budget is funded from its endowment.
How Not to Run an Endowment
Harvard, Yale, and Princeton highlight the contributions a strong endowment can make to a university. To illustrate how poor management of endowment assets can hinder a university, here are a few examples of unwise decision making.
In the early 1970s, the University of Rochester had the third largest endowment after Harvard University and the University of Texas. Due to poor returns (including losing 40% in one year), it now ranks 39th. High on the list of unfortunate decisions were large allocations to stocks of local companies like Kodak and Xerox.The stocks performed poorly, and the school had to massively downsize its faculty and academic programs in the mid- 1990s. (One of the top mistakes that individual investors make is investing all of their money in a local company or an employer’s stock.You could get rich, but the risk will be very high—just ask former Enron and Bear Stearns employees.)
The risk in placing the entire endowment portfolio in a concentrated investment is also evident at Emory University, otherwise known as Coke University. We bet you can guess what stock it held almost all of its assets in.
Boston University is another example of excessive risk taking and conflicts of interest. BU had a venture capital subsidiary that invested in 1979 in the private biotech company Seragen, which was founded by scientists affiliated with BU. BU invested over $100 million in Seragen from 1979 until 1997.To contextualize the size of this single investment, the entire BU endowment in 1979 was only $142 million (in 1976 it was only $31 million). Seragen had an initial public offering in 1992, and by late 1997 the $100 million invested by BU was worth only about $4 million. However, by this time the endowment had grown to over $400 million, so while the loss was painful, it was not catastrophic. After overcoming poor performance in the equity bear market from 2000-2003, the endowment has recovered with over $1 billion in assets (Lerner, 2007).
The concentration question is often more acute in the foundation space where many of the assets are typically in the stock of the company that made the foundation possible. The Packard Foundation held nearly 90% of its assets in Hewlett-Packard stock. At the peak of the equity bull market the Packard Foundation was worth over $15 billion, but declined by two-thirds to $5 billion by 2003 and increased to around $6.5 billion at the end of 2007.
Figure 1.3 Yale Endowment Contribution to Operating Budget
SOURCE: 2007 Yale endowment report.
Size Matters . . .
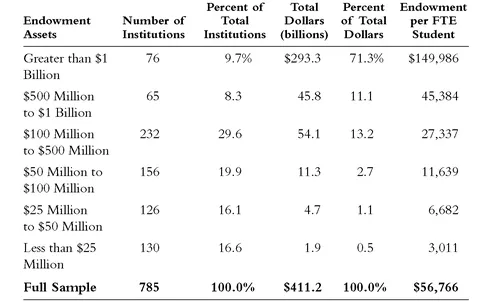
The U.S. endowments manage a lot of money (Table 1.1). The endowments that manage more than $1 billion—what we refer to as the Super Endowments—manage a collective $293 billion.4 While the 76 Super Endowments make up about 10% of the total 785 endowments, the Super Endowments represent over 70% of all the assets under management.
Table 1.1 Endowment Assets by Size
Source: 2007 NACUBO Endowment Study.
The two largest endowments at the end of 2008 were Harvard with $36.5 billion and Yale with $22.8 billion.
You may be thinking $36 billion is a lot of money, but keep in mind that the biggest pension fund, the California Public Employees’ Retirement System (CalPERS), manages over $250 billion. The largest mutual fund, the Vanguard 500 Index fund, manages over $120 billion, and both Fidelity and Barclays Global have over $1.5 trillion under management.
The average size of an endowment was about $100 million in 1992 versus over $500 million today. Table 1.2 is a list of the top 20 endowments by size for the end of the 2007 endowment fiscal year (usually June 30th).5 The 2008 NACUBO update was not available at the time of publication.
Table 1.2 Top 20 Endowments by Size
Source: 2007 NACUBO Endowment Study.
The average endowment has about $57,000 of assets per student. Compare that figure with the average of $150,000 for the Super Endowments (and over $400,000 for the private Super Endowments), and you can easily see why the schools with larger endowments have a competitive advantage. Princeton has the highest endowment per student ratio for undergraduate schools overall with over $2 million per student. Virginia Military Institute has the highest for public undergraduate schools with $312,000 per student, and The Rockefeller University has the highest for graduate schools with an astonishing $8 million per student.
Grinnell College, a small college in Iowa, now boasts the third largest endowment among liberal arts colleges, and it is in the top 10 overall for endowment assets per student. Grinnell has none other than Warren Buffett to thank—he is a lifetime trustee and advised the endowment to buy a small TV station in Dayton, Ohio for $12.9 million in 1976. Eight years later the endowment sold the station for $50 million, effectively doubling the size of the endowment. Another brilliant move for Grinnell was an early investment in Intel (Intel co-founder Robert Noyce is a Grinnell alum).
... and So Does Performance
Now that we have established that the endowments manage a lot of money, how do they perform as a group? Table 1.3 details the 1- to 10-year performance for the Super Endowments versus the average endowment (equal weighted). Over the past 10 yea...