Whether you're a full-time trader looking to make a living or a part-time trader looking to make some extra money, the foreign exchange (forex) market has what you desire--the potential to make sizeable profits and 24/7 accessibility.
But to make it in today's forex market, you need more than a firm understanding of the tools and techniques of this discipline. You need the guidance of someone who has participated, and prevailed, in this type of fast-paced environment.
Raghee Horner has successfully traded in the forex market for over a decade, and now, in Thirty Days of Forex Trading, she shares her experiences in this field by chronicling one full month of trading real money. First, Horner introduces you to the tools of the forex trade, and then she moves on to show you exactly what she does, day after day, to find potentially profitable opportunities in the forex market.
Part instructional guide, part trading journal, Thirty Days of Forex Trading will show you--through Horner's firsthand examples--how to enter the forex market with confidence and exit with profits.

- English
- ePUB (mobile friendly)
- Available on iOS & Android
eBook - ePub
DAY 1
Tuesday, January 31st
Welcome to my trading room. It’s day one and I’m excited to get this trading diary off the ground today. Each day is going to present different lessons and distinctions. What I want to do is point out and explain the reasons I make the decision to enter or exit. The setups we are going to discuss are not complicated. There really are only two types of entries: swing and momentum. Having these two entry styles at our disposal allows us to handle both sideways and trending markets. If you take the time to learn how to read the Wave and draw trend lines, support, and resistance, you are well on your way to recognizing entry opportunities. Add to those tools the price levels created by Fibonacci retracement and extension levels, psychological levels, and pivot points, and you have all the lines and levels you need to set your stop-loss and identify profit targets.
It’s an interesting day because after 18 years, Alan Greenspan has retired as Federal Reserve chairman. Like him or not, you must respect the man’s insight over the past two decades. I see and hear a lot of Monday morning quarterbacking about Mr. Greenspan’s decisions, but regardless of your opinion, today is the end of the Greenspan era and the first day of the Bernanke era. It’s history in the making. And although Benjamin Bernanke’s first testimony and congressional grilling won’t take place for another two weeks, there will be plenty of speculation between now and February 15th.
On a personal note, one drawback I am dealing with—and this is life—is that I am getting over the flu and still am oversleeping it seems every morning. I’m not 100 percent but am feeling well enough to do my homework and stay on top of some light trading. Light trading can be done one of two ways. If you have a set amount of time (preferably at least two hours) you can scan the longer-term charts for setups or you can watch and trade any intraday setups. A scan through the time frames is going to tell you which is more viable. Your other choice if you have only an hour or less is simply to focus on the longer-term time frames, and if there is nothing setting up tomorrow will be here before you know it. With that in mind, I’m going to look at the longer time frames this morning. I’ll scan all five time frames with particular attention on the 240-minute and the daily. By the way, I am flat going into this, our first day; I’m not managing any existing trades. I’ll be starting a fresh scan of the markets to see what’s on my radar this morning.
Speaking of my radar: I will scan through the euro/U.S. dollar pair (EUR/USD), as well as the Australian dollar (AUD/USD) and the British pound (GBP/USD), and remember these three typically move opposite the U.S. dollar, especially the EUR/USD. I will continue with the Swiss franc (USD/CHF), the Canadian dollar (USD/CAD), and the Japanese yen (USD/JPY). The Swiss franc moves almost tick for tick with the U.S. dollar. These six pairs make up more than 90 percent of daily trading activity. That means all over the globe as traders are waking up long before the sun’s own alarm clock goes off, the only thing on their minds is: Where is the U.S. dollar going? Never forget that you are trading the U.S. dollar when you trade forex. Yes, these are pairs and that means two, but don’t lose the pulse of the U.S. dollar because, like I said, 90 percent of every day’s trading volume focuses on traders’ varying opinions of the USD strength or weakness.
Let me add this: If you are looking at the EUR/USD long and the USD/CHF short, you are in essence entering two markets but with the same opinion. If I do put on a trade in each one of these pairs like this, then I will take into consideration that I am entering essentially the same trade in two markets.
I will also take a look at the New Zealand dollar/U.S. dollar pair (NZD/USD). There are cross rates to consider, too, but they don’t comprise a great deal of my trading activity. Think about this, though: Since the most active trading pair in forex is the EUR/USD, the cross rates based on the euro are certainly viable options. I watch some of the most watched and actively traded cross rates like the euro/Japanese yen (EUR/JPY) and euro/British pound (EUR/GBP). So on any given day I’ll be watching the six majors and perhaps a few of the euro cross rates.
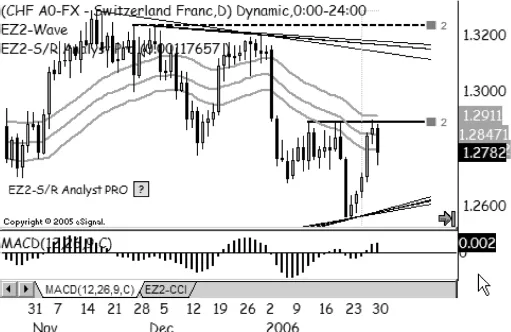
Figure 1.1 shows what’s on my radar this morning. The daily chart of the Swiss franc (USD/CHF) has nearly leveled out to a three o’clock Wave so I’m thinking “momentum trade.” And while I’m not going to assume which way the break may happen, I see that the MACD histogram is above the zero line and if prices do break out through the horizontal resistance level then I will have a confirmed trade. I’m not wild about this view, though, simply because the Wave, the first thing I look at, is not at the flat three o’clock angle that I prefer to set up momentum trades with. The angle, however, is well within the two to four o’clock area that would qualify as a sideways market. I’ll be keeping an eye on this chart going into tomorrow.
FIGURE 1.1
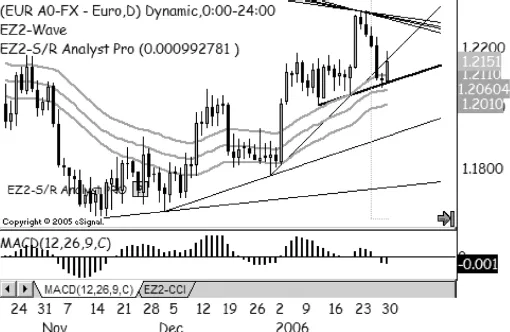
Anytime I see a setup on the Swissy I will automatically take a look at the euro. Since it is my goal to train your eyes to the nuances that I use to differentiate setups, let’s spend a few moments looking at the chart of the EUR/USD (Figure 1.2). First notice that the Wave is in what I call transition. Transitional Waves are simply those Waves that are making the shift from one recognized clock angle to another. In this case we see that the Wave is trying to level out to a three o’clock angle from an uptrending twelve to two o’clock Wave. The last three, maybe four, candles have leveled the Wave out to a flatter, more three o’clock direction, and on the 30th you can see that the candle pierced the uptrend line. The MACD histogram had a negative reading, which plotted it below the zero line, and thus it’s a confirmed, albeit a little aggressive, short because the trade is setting up fresh from transition. The sideways Wave was not in place for very long.
FIGURE 1.2
For the sake of example, let’s set this trade up so that we can walk through the three price levels that will start a trading plan.
Let’s rewind back one day to January 30th. (See Figure 1.3.) The EUR/USD broke the uptrend line at 1.2075. The MACD histogram had already gone below the zero line the previous trading session so at the time of the break the confirmation was there and waiting. I have also added the most recent Fibonacci level.
FIGURE 1.3
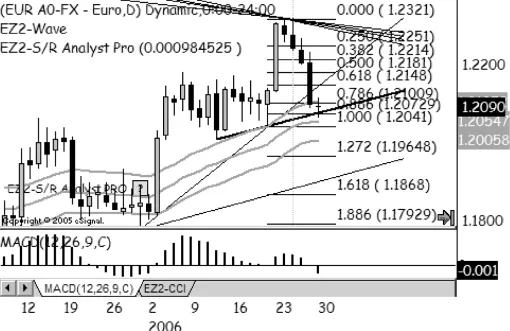
Fibonacci levels using the last major move as well as minor highs and lows are covered in my book Forex Trading for Maximum Profit, so while I will explain the levels I am drawing the Fibonacci levels from, I will not go into great length to explain the basics of last major moves and Fibonacci retracements and extensions. However, I use the following Fibonacci retracement and extension levels: 0.250, 0.382, 0.500, 0.618, 0.786, 0.886, 1.272, 1.618, 1.886. Yes, you do need them all, and your charting platform should allow you to draw these levels if you are going to use Fibonacci retracements and extensions.
There is resistance at 0.786 and 0.618, near-term levels at which we could place a stop-loss. But first we have to ask, “Where is this trade no longer valid?” That level in its most basic definition would be if prices broke through the major psychological level of 1.2200. This is because if prices can be buoyed above that level, the higher prices will attract buyers and thus be support. Even though prices are trading very close to the major psychological level of 1.2100, it is only 25 pips above the short entry and just doesn’t give this trade enough wiggle room. A daily chart, due to the fact that prices typically trade in a significant range through the entire trading day as compared to, say, the 60-minute chart, needs some room for price fluctuation. But this level is an important point to watch in case prices level off above this level in the coming days. The other level is the downtrend lines that represent the top of this triangle pattern. Do you see the triangle pattern—the convergence of the downtrend lines and the uptrend line? A pierce through the upside would certainly nullify the short trade. So t...
Table of contents
- Cover
- Contents
- Title
- Copyright
- Acknowledgments
- Introduction
- The Thirty Days of Trading
- Conclusion
- Conversation with Raghee Horner
- About the CD-ROM
- Index
- Download CD/DVD content
Frequently asked questions
Yes, you can cancel anytime from the Subscription tab in your account settings on the Perlego website. Your subscription will stay active until the end of your current billing period. Learn how to cancel your subscription
No, books cannot be downloaded as external files, such as PDFs, for use outside of Perlego. However, you can download books within the Perlego app for offline reading on mobile or tablet. Learn how to download books offline
We are an online textbook subscription service, where you can get access to an entire online library for less than the price of a single book per month. With over 1.5 million books across 990+ topics, we’ve got you covered! Learn about our mission
Look out for the read-aloud symbol on your next book to see if you can listen to it. The read-aloud tool reads text aloud for you, highlighting the text as it is being read. You can pause it, speed it up and slow it down. Learn more about Read Aloud
Yes! You can use the Perlego app on both iOS and Android devices to read anytime, anywhere — even offline. Perfect for commutes or when you’re on the go.
Please note we cannot support devices running on iOS 13 and Android 7 or earlier. Learn more about using the app
Please note we cannot support devices running on iOS 13 and Android 7 or earlier. Learn more about using the app
Yes, you can access Thirty Days of FOREX Trading by Raghee Horner in PDF and/or ePUB format, as well as other popular books in Business & Foreign Exchange. We have over 1.5 million books available in our catalogue for you to explore.