eBook - ePub
Currency Trading and Intermarket Analysis
How to Profit from the Shifting Currents in Global Markets
- English
- ePUB (mobile friendly)
- Available on iOS & Android
eBook - ePub
Currency Trading and Intermarket Analysis
How to Profit from the Shifting Currents in Global Markets
About this book
As head FX strategist at CMC Markets–one of the world's leading forex/commodity brokers–Ashraf Laidi understands the forces shaping today's currency market and their interplay with interest rates, equities, and commodities. And now, with Currency Trading and Intermarket Analysis, he shares his extensive experiences in this field with you. Throughout the book, Laidi outlines the tools needed to understand the macroeconomic and financial nuances of this dynamic field and provides you with insights that are essential to making the most of your time within it.
Trusted by 375,005 students
Access to over 1.5 million titles for a fair monthly price.
Study more efficiently using our study tools.
CHAPTER 1
Gold and the Dollar
The relationship between gold and the dollar has long mirrored the decades-old battle between real tangible assets and financial assets. Traditionally the dollar has been the representative currency in any analysis of gold, due to its sustained role as the world’s reserve currency and the preferred means of exchange and invoicing transactions. The creation of the euro in 1999 and its subsequent ascent as a credible and strengthening currency has certainly started to challenge the dollar’s leading position among world currencies, but the euro has yet to dethrone the greenback from its dominating perch. Nonetheless, the probability of such occurrence has been gradually on the rise and may fully materialize as early as 2015.
Considering the 400-year historical connection between gold and paper currencies, the 100 years of dollar dominance, and the role of gold in initiating the present world currency order, it is appropriate to begin this book with the evolution of the relationship between gold, the dollar, and other currencies. Aside from examining the eventual trend between gold and the greenback, this chapter sheds light on how currency market participants can absorb the price developments in gold vis-à-vis currencies and equities in order to gain a better grasp of the cyclical shifts underpinning markets and economics.
During the final third of the nineteenth century, most countries abandoned the silver standard in favor of a gold-based currency standard. These moves were largely triggered by Germany’s receipt of a war indemnity from France in gold following the Franco-Prussian war, prompting Germany to unload silver on its trading partners. As Germany adopted the deutsche mark, backing it with a strict gold standard, most nations followed suit and opted for the metal. But the merits of the gold standard were in doubt after the British economy began to slump in the 1880s.
The gold exchange standard ultimately saw its demise in the 1920s when World War I disrupted trade flows and the free movement of gold. In 1931, massive gold withdrawals from London banks triggered Britain’s abandonment of the gold standard, and three years later the United States introduced the U.S. Gold Reserve Act under President Roosevelt’s New Deal. The Act reset the value of gold at $35 per ounce from $20.67 per ounce and ended the legal ownership of gold coins and bullion by citizens for over 20 years.
END OF BRETTON WOODS SYSTEM MARKS GOLD’S TAKEOFF
The Bretton Woods Agreement of 1944 launched the first system of convertible currencies and fixed exchange rates, requiring participating nations to maintain the value of their currency within a narrow margin against the U.S. dollar and a corresponding gold rate of $35 per gold ounce. But the U.S. dollar began to lose value in the 1950s and 1960s, due to surging U.S. capital outflows aimed at Europe’s postwar recovery, as well as an expanding global supply of U.S. dollars, which made it increasingly difficult for the United States to convert dollars into gold on demand at a fixed exchange rate.
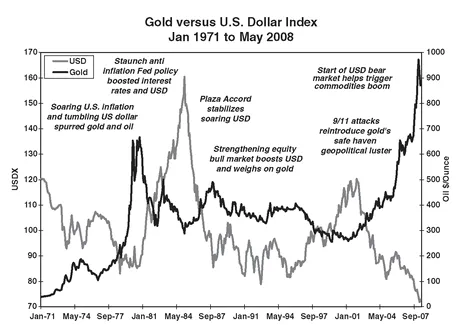
The surge of the Eurodollar market in the late 1960s—where international banks held U.S. dollars outside the United States—coupled with the escalating costs of the Vietnam War led to the near depletion of U.S. gold reserves and a devaluation of the U.S. dollar relative to gold. At the same time, the United States kept on printing more dollars for which there was no gold backing. This persisted as long as the world was willing to accept those dollars with little question. But when France demanded in the late 1960s that the U.S. fulfill its promise to pay one ounce of gold for each $35 it delivered to the U.S. Treasury, a shortage of gold began to ensue relative to a widening supply of dollars. On August 15, 1971, Nixon shut down the gold window, refusing to pay out any of the remaining 280 million ounces of gold. Figure 1.1 shows the inverse relationship between gold and the dollar since the fall of Bretton Woods.
A series of dollar devaluations in the early 1970s eventually led to the end of the Bretton Woods system of fixed exchange rates, paving the way for a long-drawn-out decline in the dollar. This triggered a rapid ascent in the dollar value of two of the world’s most vital commodities, metals and oil. Oil producers holding the surplus of devalued U.S. dollars had no choice but to purchase gold in the marketplace, driving both the fuel and the metals higher and further dragging down the value of the dollar. A series of devaluations in 1972 culminated in the end of the Bretton Woods system in February 1973. The dollar became freely traded and freely sold.
FIGURE 1.1 Gold prices generally move in inverse relation to the U.S. dollar as they compete over inflation risk, geopolitical uncertainty, and time value of money.
From January 1971 to February 1973, the dollar dropped 26.0 percent against the yen, 4.0 percent against the British pound, and 17 percent against the deutsche mark. And from 1971 to 1980, the dollar lost 30 percent of its value in trade-weighted terms against a basket of currencies (deutsche mark, Japanese yen, British pound, Canadian dollar, Swiss franc, and Swedish krone).
FED TIGHTENING AND FX INTERVENTIONS REIN IN GOLD RALLY
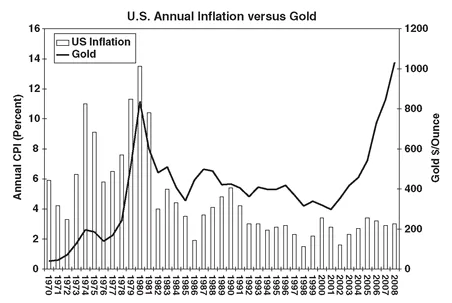
A series of geopolitical events coupled with rising U.S. inflation increased gold prices more than fivefold in the later 1970s as financial markets sought refuge in the security of the precious metal from the eroding value of paper money. The falling dollar was exacerbated by OPEC’s price hikes, which added fuel to the inflation fire. Surging social unrest in 1978 led to the 1979 hostage crisis at the U.S. Embassy in Tehran, which culminated in the overthrowing of the Shah and the Iranian Revolution. Oil prices nearly tripled between 1979 and 1980, and gold’s last major surge spiked before starting a 20-year period of hibernation. The Soviet invasion and occupation of Afghanistan in December 1979 raised fears of renewed tensions between the United States and the Soviet Union, further destabilizing the security outlook in the region. In just three weeks, gold jumped from $520 to $835 per ounce. But what later ensued was a testament to the importance of economics over geopolitics in the behavior of gold.
In autumn 1979, U.S. inflation hit a 32-year high of 13 percent, despite double-digit interest rates. In October the Federal Reserve, under the new leadership of Paul Volcker, made the historical decision to shift monetary policy toward the targeting of money supply, away from the targeting interest rates. This meant that the Fed would manage monetary policy so as to lower monetary aggregates, with interest rates acting as a secondary element. The two years of ultratight monetarism saw interest rates hit 20 percent in 1981, leaving international investors little choice but to seek the high-yielding greenback as a way to offset double-digit inflation. Figure 1.2 shows U.S. inflation was more than halved in 1982, dragging gold down with it. In the first half of the 1980s, the dollar index jumped 50 percent while gold tumbled by the same amount to hit a six-year low.
FIGURE 1.2 Deteriorating geopolitics of the 1970s propelled gold prices up on the back of soaring inflation before Fed’s tight monetarism headed off 20-year bear market in gold.
Source: U.S. Geological Survey.
CENTRAL BANKS’ GOLD SALE AGREEMENTS
In 1997-1999, several central banks from Western Europe sold substantial amounts of their gold in an uncoordinated manner, with the principal aim of realizing substantial capital gains in the gold holdings they had purchased several decades earlier. Those gains helped beef up national budgets and state finances. The 11 European nations that first joined the Eurozone had to abide by strict fiscal conditions requiring that budget deficits not exceed 3 percent of GDP. The gold sales helped erode the value of the metal by 25 percent between 1995 and 1998, and lifted the U.S. dollar against the Japanese yen and deutsche mark by 84 percent and 36 percent respectively.
Central bank gold sales were particularly punishing for the precious metal in 1999 as both the Bank of England and Swiss National Bank stepped up their selling. In May 1999, gold’s decline began after the announcement from the UK Treasury that it planned to sell 415 tons of gold. The announcement triggered a massive wave of producers’ hedging activity and front-running speculation. A month later, the Swiss National Bank (SNB) decided that gold was no longer an integral part of monetary policy making and announced the sale of half of its 2,590 tons of gold reserves over the next five or six years. The central banks’ announcements led to a 13 percent fall in gold to $252 per ounce, the lowest level in 20 years. Without any systematic limits on volume and frequency of the sales and no coordination, central banks were free to dump gold at their own choosing, creating sharp declines in the metal, and rapid moves in currency markets.
The resulting price action in gold ultimately paved the way for the first central bank agreement on gold sales, which provided the framework for subsequent gold sales by the Swiss National Bank, the European Central Bank (ECB), and 13 European national central banks. Under the agreement, the SNB sold 1,170 tons, which accounted for the bulk of the total 2,000 tons in sales by all participating central banks. As gold prices accelerated their fall, the European central banks sought to boost confidence in the metal and stabilize the plummeting value of their newly created euro currency by establishing the Washington Agreement on Gold. On September 26, 1999, 15 central banks (the ECB plus the 11 founding members of the Eurozone, Sweden, Switzerland, and the United Kingdom) announced a collective cap on their gold sales at around 400 tonnes per year over the next five years.
When the Washington Agreement on Gold expired in 2004, a new agreement was reached for the 2004-2009 period, called the Central Bank Agreement on Gold. The new arrangement raised the amount of annual gold sales to 500 tonnes from 400 tonnes set in the original agreement. The higher threshold of gold sales would help stabilize the value of the U.S. dollar, after the currency had lost 22 percent between 1999 and 2004 and the metal rallied 60 percent over the same period. As of 2007, central banks held nearly 20 percent of the worlds’ aboveground gold stocks as a reserve asset, with individual nations holding approximately 10 percent of their reserves in the metal.
GOLD-USD INVERSE RELATION
One of the most widely known relationships in currency markets is perhaps the inverse relation between the U.S. dollar (USD) and the value of gold. This relationship stems mainly from the fact that gold serves as an inflation hedge through its metal value, while the U.S. dollar holds its value via the interest rate commanded by it. As the dollar’s exchange value falls, it takes more dollars to buy gold, therefore lifting the value of gold. Conversely, when the dollar’s exchange value rises, it takes fewer dollars to buy gold, thereby dragging down the dollar price of gold. Unlike currencies, government bonds, and corporate stocks—all of which are determined by demand and supply as well as the issuing power of central banks and corporations—gold is largely dependent on demand and supply and is therefore immune to shifts in monetary and corporate policies and the new issuance of equity, debt, and currency.
While gold’s distinction from fiat currencies maintains an inverse relation with currencies other than the U.S. dollar, the negative correlation remains most striking against the U.S. dollar due to the currency’s dominance in central bank currency reserves. Figure 1.1 showed the inverse relationship between gold and the dollar from 1970 to 2008. Figure 1.3 illustrates the highly inverse relationship between g...
Table of contents
- Praise
- Title Page
- Copyright Page
- Dedication
- Foreword
- Preface
- Acknowledgements
- CHAPTER 1 - Gold and the Dollar
- CHAPTER 2 - Oil Fundamentals in the Currency Market
- CHAPTER 3 - When the Dollar Was King (1999-2001)
- CHAPTER 4 - The Dollar Bear Awakens (2002-2007)
- CHAPTER 5 - Risk Appetite in the Markets
- CHAPTER 6 - Reading the Fed via Yield Curves, Equities, and Commodities
- CHAPTER 7 - U.S. Imbalances, FX Reserve Diversification, and the U.S. Dollar
- CHAPTER 8 - Commodities Supercycles and Currencies
- CHAPTER 9 - Selected Topics in Foreign Exchange
- Bibliography
- About the Author
- Index
Frequently asked questions
Yes, you can cancel anytime from the Subscription tab in your account settings on the Perlego website. Your subscription will stay active until the end of your current billing period. Learn how to cancel your subscription
No, books cannot be downloaded as external files, such as PDFs, for use outside of Perlego. However, you can download books within the Perlego app for offline reading on mobile or tablet. Learn how to download books offline
Perlego offers two plans: Essential and Complete
- Essential is ideal for learners and professionals who enjoy exploring a wide range of subjects. Access the Essential Library with 800,000+ trusted titles and best-sellers across business, personal growth, and the humanities. Includes unlimited reading time and Standard Read Aloud voice.
- Complete: Perfect for advanced learners and researchers needing full, unrestricted access. Unlock 1.5M+ books across hundreds of subjects, including academic and specialized titles. The Complete Plan also includes advanced features like Premium Read Aloud and Research Assistant.
We are an online textbook subscription service, where you can get access to an entire online library for less than the price of a single book per month. With over 1.5 million books across 990+ topics, we’ve got you covered! Learn about our mission
Look out for the read-aloud symbol on your next book to see if you can listen to it. The read-aloud tool reads text aloud for you, highlighting the text as it is being read. You can pause it, speed it up and slow it down. Learn more about Read Aloud
Yes! You can use the Perlego app on both iOS and Android devices to read anytime, anywhere — even offline. Perfect for commutes or when you’re on the go.
Please note we cannot support devices running on iOS 13 and Android 7 or earlier. Learn more about using the app
Please note we cannot support devices running on iOS 13 and Android 7 or earlier. Learn more about using the app
Yes, you can access Currency Trading and Intermarket Analysis by Ashraf Laïdi in PDF and/or ePUB format, as well as other popular books in Business & Finance. We have over 1.5 million books available in our catalogue for you to explore.