Revised and up to date, the Second Edition includes valuable information that addresses questions such as:
* What is transparency and why do we care?
* How can financial statements inform investors?
* How can financial statements mislead investors?
* How has the Sarbanes-Oxley Act changed companies' financial disclosures?
* What should you look for in financial disclosures when judging a company's financial health?
* How do financial statements relate to the value of a company's stock?
* Why is cash flow so important to a company's financial health?
Throughout Analysis of Financial Statements, Second Edition, the authors demonstrate the nuts and bolts of financial analysis by applying the techniques to actual companies. The authors set the stage for financial analysis in Part One with their discussions of financial statements and the quality of financial statements. In Part Two, they walk you through how to judge a company's financial health using financial disclosures in financial ratio analysis, earnings analysis, and cash flow analysis. In Part Three, the authors take analysis a step further by discussing how investors and creditors can use financial statements to more effectively assess a company's performance and risk. Peterson and Fabozzi wrap up this Second Edition with a set of lessons for investors and analysts:
Lesson 1: Understand what you are looking at
Lesson 2: Read the fine print
Lesson 3: If it's too good to be true, it may be
Lesson 4: Follow the money
Lesson 5: Understand the risks
- English
- ePUB (mobile friendly)
- Available on iOS & Android
eBook - ePub
Analysis of Financial Statements
Part One
The Basics
Chapter 1
Introduction
The investments arena is large, complex, and dynamic. These characteristics make it interesting to study, but also make it challenging to keep up with. What changes? Laws and regulations, the introduction of new types of securities and derivatives, innovations in markets and trading, an economy that is persistently changing, and company events, to name a few. Add to this mix the political, technological, and environmental changes that occur throughout the world every day, and you have quite a task to understand investment opportunities and investment management.
There is a wealth of financial information about companies available to financial analysts and investors. The Internet has made vast amounts of information available to everyone, displacing print as a means of communication. Consider the amount of information available about Microsoft Corporation. Not only can investors find annual reports, quarterly reports, press releases and links to the companies’ filings with regulators on Microsoft’s web site, anyone can download data for analysis in spreadsheet form and can listen in on Microsoft’s management’s conversations with analysts.
Availability and convenience has eased the data-gathering task of financial analysis. What remains, however, is the more challenging task of analyzing this information in a meaningful way. Recent scandals involving financial disclosures increase the importance of knowing just how to interpret financial information. In response to these scandals, Congress passed the Sarbanes-Oxley (SOX) Act of 2002, which increases the responsibility of publicly traded corporations, accounting firms performing audits, companies’ management, and financial analysts. And while this Act is an attempt to restore faith in financial disclosures, investors and analysts must still be diligent in interpreting financial data in a meaningful way. The purpose of this book is to assist the analyst and investor in understanding financial information and using this information in an effective manner.
WHAT IS FINANCIAL ANALYSIS?
We focus on financial analysis in this book, which is the selection, evaluation, and interpretation of financial data and other pertinent information to assist in evaluating the operating performance and financial condition of a company. The operating performance of a company is a measure of how well a company has used its resources—its assets, both tangible and intangible—to produce a return on its investment. The financial condition of a company is a measure of its ability to satisfy its obligations, such as the payment of interest on its debt in a timely manner.
Financial reporting is the collection and presentation of current and historical financial information of a company. This reporting includes the annual reports sent to shareholders, the filings with the Securities and Exchange Commission for publicly traded companies, and press releases and other reports made by the company. Financial analysis takes that information—and much more—and makes sense out of in terms of what it says about the company’s past performance and condition and—more importantly—what it says about the company’s future performance and condition.
The financial analyst must determine what information to analyze (e.g., financial reports, market information, economic information) and how much information (Five years? Ten years?). The analyst must sift through the vast amount of information, selecting the information that is most important in assessing the company’s current and future performance and condition. A part of this analysis requires the analyst to assess the quality of the information. Though publicly traded companies must report their financial information according to generally accepted accounting principles (GAAP), there is still some leeway that the reporting company has within these principles. The analyst must understand the extent of this leeway and what this implies for the company’s future performance.
The analyst has many tools available in the analysis of financial information. These tools include financial ratio analysis and quantitative analysis. The analyst must understand how to use these tools in the most effective manner.
WHAT HAPPENS IF WE ARE NOT LOOKING CLOSELY AT FINANCIAL INFORMATION?
Several of the scandals that arose in the past few years were actually detectable using basic financial analysis and common sense. It is not possible to spot all cases of fraud and manipulation, but there are some telltale signs that should raise caution flags in analysis. Examples of these signs:
- Revenue growth that is out of line with others in the same industry or not reasonable given the current economic climate
- Profits that are increasing at a much faster rate than cash flows generated from operations
- Debt disappearing from the balance sheet
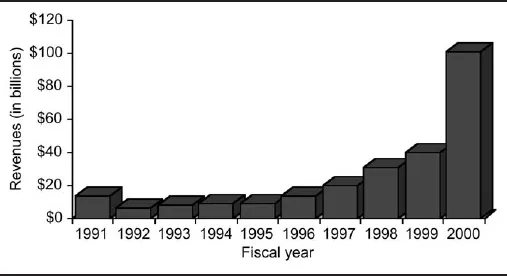
Consider Enron Corporation, Enron’s revenues grew from a little over $13.5 billion to over $100 billion in the 10-year period from 1991 through 2000 as shown in Exhibit 1.1; in other words, its revenues grew at an average rate of over 25% per year. During this period, Enron’s debts grew too, from 76% of its assets to over 82% of its assets. Enron experienced significant growth and reported significant debt, becoming one of the largest corporations in the United States within 15 years of becoming a publicly traded corporation.
EXHIBIT 1.1 Enron’s Revenues, 1991–2000
Source: Enron, Inc. 10-K filings, various years.
Since 2001 Enron has been embroiled in a financial scandal that involved removing debt from its balance sheet into special purpose entities. While the scandal was shocking, Enron had actually provided information in its financial disclosures that hinted at the problems.
Enron disclosed in footnotes to its 2000 10-K filing that it had formed wholly owned and majority-owned limited partnerships “for the purpose of holding $1.6 billion of assets contribute by Enron.” [Enron 10-K, 2000] The result?
1. Assets and liabilities of Enron did not appear directly in its balance sheet.
2. Gains on Enron stock invested in by these partnerships found their way to Enron’s income statement.
The most notorious deal involved Joint Energy Development Investment Limited Partnership II (JEDI II). Enron executives created this partnership using Enron funds and loans fed through Chewco Investments. Though accounted for as a special purpose entity, with its assets and liabilities removed from Enron’s balance sheet, there was in...
Table of contents
- Cover
- Contents
- Title
- Copyright
- Dedication
- Preface
- About the Authors
- Part One: The Basics
- Part Two: Analysis of Financial Statements
- Part Three: Applying Financial Analysis
- Index
Frequently asked questions
Yes, you can cancel anytime from the Subscription tab in your account settings on the Perlego website. Your subscription will stay active until the end of your current billing period. Learn how to cancel your subscription
No, books cannot be downloaded as external files, such as PDFs, for use outside of Perlego. However, you can download books within the Perlego app for offline reading on mobile or tablet. Learn how to download books offline
Perlego offers two plans: Essential and Complete
- Essential is ideal for learners and professionals who enjoy exploring a wide range of subjects. Access the Essential Library with 800,000+ trusted titles and best-sellers across business, personal growth, and the humanities. Includes unlimited reading time and Standard Read Aloud voice.
- Complete: Perfect for advanced learners and researchers needing full, unrestricted access. Unlock 1.5M+ books across hundreds of subjects, including academic and specialized titles. The Complete Plan also includes advanced features like Premium Read Aloud and Research Assistant.
We are an online textbook subscription service, where you can get access to an entire online library for less than the price of a single book per month. With over 1.5 million books across 990+ topics, we’ve got you covered! Learn about our mission
Look out for the read-aloud symbol on your next book to see if you can listen to it. The read-aloud tool reads text aloud for you, highlighting the text as it is being read. You can pause it, speed it up and slow it down. Learn more about Read Aloud
Yes! You can use the Perlego app on both iOS and Android devices to read anytime, anywhere — even offline. Perfect for commutes or when you’re on the go.
Please note we cannot support devices running on iOS 13 and Android 7 or earlier. Learn more about using the app
Please note we cannot support devices running on iOS 13 and Android 7 or earlier. Learn more about using the app
Yes, you can access Analysis of Financial Statements by Frank J. Fabozzi,Pamela P. Peterson in PDF and/or ePUB format, as well as other popular books in Business & Finance. We have over 1.5 million books available in our catalogue for you to explore.