![]()
CHAPTER 1
CANDLESTICK BASICS AND TESTING REQUIREMENTS
Candlestick charting was developed in Japan about 300 years ago as traders noticed specific price patterns and began using them for forecasting price movements in the rice market. Japan had an active market in trading rice, and even rice futures, during the 1700s. Traders involved in this market noticed that certain patterns in price movements often preceded moves in the price of rice. They began to look for and study these patterns and to use them in determining whether to take positions.
While candlestick techniques have been used for hundreds of years in Japan, they are a relatively new tool for trading stocks in the West. It is thought that candlestick techniques started moving beyond a few pioneers in Western markets during the 1980s and gained popularity during the 1990s after the publication of several books on the subject, most notably Steve Nison’s Beyond Candlesticks: New Japanese Charting Techniques Revealed and Strategies for Profiting with Japanese Candlestick Charts.
Some traders feel that candlestick patterns are mysterious and must be highly effective if they have been in use for hundreds of years; however, there are many products that have been around a long time and may or may not be effective. It’s not the length of time something has been around that matters; it is whether it produces results. Some candlestick patterns are great tools; others are interesting but less effective. The trick for traders is to know which ones work best, and how to improve the others.
Many candlestick patterns were given names 300 years ago by the Japanese rice traders. The traders used the names to describe the pattern. Some, like the hammer pattern, look just like what the name suggests. Others seem a little less descriptive to Western traders. However, names of common Western patterns like island top, climax run, head and shoulders, and double top may also seem strange to new traders. The strangeness of the name is unusual at first, but soon becomes just a name as the trader studies and becomes familiar with the pattern.
In any case, a name is a name. It is the ability to recognize the pattern that is important. In this chapter, we will look at several popular candlestick patterns and then learn how and when to pull them from our toolbox and put them to use. But first, let’s go over the basics.
WHAT IS A CANDLESTICK
Candlestick patterns, like Western patterns, show relationships between the opening, closing, high, and low prices of a stock on one or more days. Bar charts and candlesticks are both constructed from the same information; they just display it in a slightly different manner.
A basic candlestick representation of each trading day looks like Figure 1.1. The rectangular area is the candlestick body and represents the distance or price change between the opening and the closing price for the day. If the stock moved up on the day, the candlestick body color is white. If the stock moved down, the candlestick body is black. The different body colors make it easy to glance at a candlestick chart and tell instantly if the stock was up or down for the day. If the stock is consistently moving up, you will see a chart with a lot of white bodies. If the stock is mostly moving down, you will see a chart with a lot of black bodies.
The thin lines on the top and bottom of the candlestick body are called shadows or tails. The end of the upper shadow shows the high price for the day, the end of the lower shadow shows the low price for the day. The day’s trading range is the difference between the top of the upper shadow and the bottom of the lower shadow. Single day candlestick patterns are defined by the relationships between the size of the body and the two tails. Multi-day patterns are defined by the relationship of the body and shadow patterns across more than one day.
Candlestick patterns, like Western patterns, may be formed over one or more days. An island top can form in three days, a head and shoulders may form over several weeks. A hammer is a one day candlestick pattern, while a bullish engulfing pattern forms over two days. In general, patterns occurring over a few days may indicate short term direction, and patterns occurring over several weeks may indicate longer-term direction of prices. Now let’s take a look at some of the more popular candlestick patterns. After learning these, we will investigate how often they work and what makes them effective.
HAMMER AND HANGING MAN CANDLESTICK PATTERNS
THE HAMMER
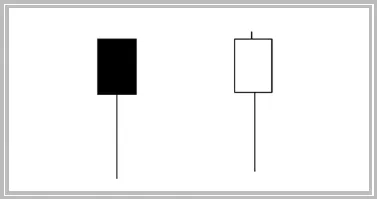
The hammer and hanging man patterns are identical and have long lower shadows, short or no upper shadows, and small bodies. The pattern, shown in Figure 1.2, is called a hammer if it occurs during a downtrend and a hanging man if it occurs during an uptrend. The color of the body is not important. The lower shadow should be twice the length of the body or more. There should be no or very little upper shadow, indicating that the day’s high should be near the close for a white body and near the open for a black body.
Figure 1.3 shows a candlestick chart of BBH. BBH had been in a clear downtrend during January, February, and the first part of March 2007. On 03/14/07, BBH formed a hammer pattern as marked by the up arrow. The hammer pattern marked the end of the downtrend, and BBH rose more than seven points during the next five sessions. Obviously, not every hammer pattern is a profitable trade. The important question for traders is: how often does the pattern result in profitable trades, and are there other factors that influence the results? These questions can be answered by using backtesting techniques to examine the results of thousands of trades.
Chapter four will focus on trading the hammer pattern and address questions that successful traders must know the answers to:
- What constitutes a small upper shadow?
- How does the shadow length affect trading results?
- How do closing price and volume affect trading results?
- Does the size of the day’s trading range affect the results of trading hammers?
THE HANGING MAN
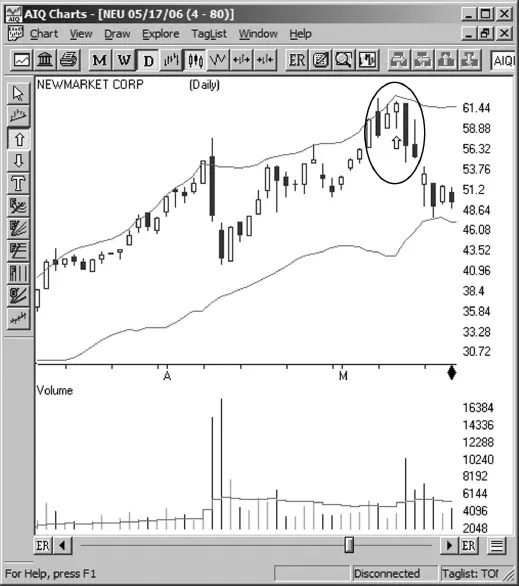
Figure 1.4 shows a candlestick chart of NEU during the first half of 2006. On 05/09/06, NEU formed a hanging man pattern as marked by the up arrow in Figure 1.4. The hanging man pattern marked the end of the uptrend in NEU and subsequently, it declined nearly 12 points during the next four trading sessions.
When traders get together and discuss trading patterns or setups, someone usually asks why a particular pattern works. To explain trading patterns, the market is often described as a battle between the bulls trying to drive prices up, and the bears trying to drive prices down. The patterns are the result of this contest between the bulls and bears. In the case of a hammer pattern, the stock has been in a downtrend, indicating that the bears have control. When the hammer forms, the price is initially driven down further by the bears, forming the long lower tail. At some point during the day, the bulls step in and drive the price back up near the opening, forming the small body. The hammer forms at a point where bullish investors are willing to step in; therefore, the downtrend ends and the stock begins to move up.
Some traders will start using a pattern or trading system when they hear an explanation of why it works that makes sense to them. We all have a need to understand why something should work. However, for traders, it is more important to know how often a pattern works rather than an explanation of why it works. Knowing why a pattern works is interesting. Knowing how often a trading pattern works can be profitable. And, knowing in what specific market conditions a pattern works best can be very profitable. In the next chapter we will address these issues and develop a working knowledge of when to use candlestick patterns and when to use another tool from the trading toolbox.
Chapter five will look at issues related to trading the hanging man pattern including:
- How do bullish or bearish market environments affect trading results for the hanging man pattern?
- What happens if the pattern occurs on the recent highs of the move?
- Does using the MACD for timing improve results?
- Does waiting for confirmation improve results?
- How long should a position be held?
BULLISH AND BEARISH ENGULFING CANDLESTICK PATTERNS
BULLISH ENGULFING
The hammer and hanging man candlestick patterns occur in a single day. Engulfing patterns take two days to form and focus on the relationship between the candlestick bodies of both days. The candlestick shadows are not important to defining the pattern. A bullish engulfing pattern occurs when the white body of the second candlestick engulfs or covers the black body of the first candlestick in the pattern as shown in Figure 1.5. A bearish engulfing pattern occurs when the black body of the second day engulfs or covers the white body of the first day.
The bullish engulfing pattern is a reversal pattern formed when the stock is in a downtrend, and often signals a short term reversal or bounce in the stock price. The first candlestick in this two day pattern has a black body, indicating the bearish downtrend is still intact. Black bodies indicate the stock closed down for the day. The second candlestick has a white body extending below the first day’s body, indicating the stock gapped down at the open. The lower end of a black body is the day’s closing price, and the lower end of a white body is the day’s opening price. Thus, when the second day’s white body engulfs or covers the first day’s black body, the price gaps down in the morning indicating more bearishness, then reverses to close above the previous day’s opening, indicating a reversal in sentiment for the second day that often continues in the short term.
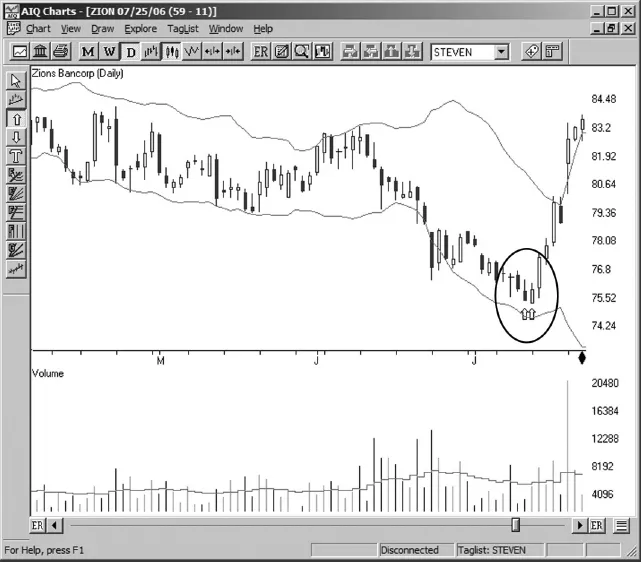
Figure 1.6 shows a four-month candlestick chart of ZION. During late June and early July of 2006, ZION was in a clear downtrend. On July 13 and July 14, it formed the two day bullish engulfing pattern as marked by the up arrows. During the five days following the formation of the bullish engulfing pattern, ZION ran up more than seven points.
The bullish engulfing pattern does not always mark the end of a downtrend, but often does. Trading is a statistical business and patterns do not work all the time. Some trading patterns yield positive r...