![]()
1
Introduction to EEG
The neural activity of the human brain starts between the 17th and 23rd week of prenatal development. It is believed that from this early stage and throughout life electrical signals generated by the brain represent not only the brain function but also the status of the whole body. This assumption provides the motivation to apply advanced digital signal processing methods to the electroencephalogram (EEG) signals measured from the brain of a human subject, and thereby underpins the later chapters of the book.
Although nowhere in this book do the authors attempt to comment on the physiological aspects of brain activities there are several issues related to the nature of the original sources, their actual patterns, and the characteristics of the medium, that have to be addressed. The medium defines the path from the neurons, as so-called signal sources, to the electrodes, which are the sensors where some form of mixtures of the sources are measured.
Understanding of neuronal functions and neurophysiological properties of the brain together with the mechanisms underlying the generation of signals and their recordings is, however, vital for those who deal with these signals for detection, diagnosis, and treatment of brain disorders and the related diseases. A brief history of EEG measurements is first provided.
1.1 History
Carlo Matteucci (1811–1868) and Emil Du Bois-Reymond (1818–1896) were the first people to register the electrical signals emitted from muscle nerves using a galvanometer and established the concept of neurophysiology [1,2]. However, the concept of action current introduced by Hermann Von Helmholz [3] clarified and confirmed the negative variations that occur during muscle contraction.
Richard Caton (1842–1926), a scientist from Liverpool, England, used a galvanometer and placed two electrodes over the scalp of a human subject and thereby first recorded brain activity in the form of electrical signals in 1875. Since then, the concepts of electro-(referring to registration of brain electrical activities) encephalo- (referring to emitting the signals from the head), and gram (or graphy), which means drawing or writing, were combined so that the term EEG was henceforth used to denote electrical neural activity of the brain.
Fritsch (1838–1927) and Hitzig (1838–1907) discovered that the human cerebral can be electrically stimulated. Vasili Yakovlevich Danilevsky (1852–1939) followed Caton’s work and finished his PhD thesis in the investigation of the physiology of the brain in 1877 [4]. In this work, he investigated the activity of the brain following electrical stimulation as well as spontaneous electrical activity in the brain of animals.
The cerebral electrical activity observed over the visual cortex of different species of animals was reported by Ernst Fleischl von Marxow (1845–1891). Napoleon Cybulski (1854–1919) provided EEG evidence of an epileptic seizure in a dog caused by electrical stimulation.
The idea of the association of epileptic attacks with abnormal electrical discharges was expressed by Kaufman [5]. Pravidch-Neminsky (1879–1952), a Russian physiologist, recorded the EEG from the brain, termed the dura, and the intact skull of a dog in 1912. He observed a 12–14 cycle/s rhythm under normal conditions, which slowed under asphyxia and later called it the electrocerebrogram.
The discoverer of the existence of human EEG signals was Hans Berger (1873–1941). He began his study of human EEGs in 1920 [6]. Berger is well known by almost all electroencephalographers. He started working with a string galvanometer in 1910, then migrated to a smaller Edelmann model, and after 1924, to a larger Edelmann model. In 1926, Berger started to use the more powerful Siemens double coil galvanometer (attaining a sensitivity of 130 µV/cm) [7]. His first report of human EEG recordings of one to three minutes duration on photographic paper was in 1929. In this recording he only used a one-channel bipolar method with fronto-occipital leads. Recording of the EEG became popular in 1924. The first report of 1929 by Berger included the alpha rhythm as the major component of the EEG signals, as described later in this chapter, and the alpha blocking response.
During the 1930s the first EEG recording of sleep spindles was undertaken by Berger. He then reported the effect of hypoxia on the human brain, the nature of several diffuse and localized brain disorders, and gave an inkling of epileptic discharges [8]. During this time another group established in Berlin-Buch and led by Kornmüller, provided more precise recording of the EEG [9]. Berger was also interested in cerebral localization and particularly in the localization of brain tumours. He also found some correlation between mental activities and the changes in the EEG signals.
Toennies (1902–1970) from the group in Berlin built the first biological amplifier for the recording of brain potentials. A differential amplifier for recording EEGs was later produced by the Rockefeller foundation in 1932.
The importance of multichannel recordings and using a large number of electrodes to cover a wider brain region was recognized by Kornmüller [10]. The first EEG work focusing on epileptic manifestation and the first demonstration of epileptic spikes were presented by Fischer and Löwenbach [11–13].
In England, W. Gray Walter became the pioneer of clinical electroencephalography. He discovered the foci of slow brain activity (delta waves), which initiated enormous clinical interest in the diagnosis of brain abnormalities. In Brussels, Fredric Bremer (1892–1982) discovered the influence of afferent signals on the state of vigilance [14].
Research activities related to EEGs started in North America in around 1934. In this year, Hallowell Davis illustrated a good alpha rhythm for himself. A cathode ray oscilloscope was used around this date by the group in St Louis University in Washington, in the study of peripheral nerve potentials. The work on human EEGs started at Harvard in Boston and the University of Iowa in the 1930s. The study of epileptic seizure developed by Fredric Gibbs was the major work on EEGs during these years, as the realm of epileptic seizure disorders was the domain of their greatest effectiveness. Epileptology may be divided historically into two periods [15]: before and after the advent of EEG. Gibbs and Lennox applied the idea of Fischer based on his studies about picrotoxin and its effect on the cortical EEG in animals to human epileptology. Berger [16] showed a few examples of paroxysmal EEG discharges in a case of presumed petit mal attacks and during a focal motor seizure in a patient with general paresis.
As the other great pioneers of electroencephalography in North America, Hallowel and Pauline Davis were the earliest investigators of the nature of EEG during human sleep. A. L. Loomis, E. N. Harvey, and G. A. Hobart were the first who mathematically studied the human sleep EEG patterns and the stages of sleep. At McGill University, H. Jasper studied the related behavioural disorder before he found his niche in basic and clinical epileptology [17].
The American EEG Society was founded in 1947 and the First International EEG Congress was held in London, United Kingdom, around this time. While the EEG studies in Germany were still limited to Berlin, Japan gained attention by the work of Motokawa, a researcher of EEG rhythms [18]. During these years the neurophysiologists demonstrated the thalamocortical relationship through anatomical methods. This led to the development of the concept of centrencephalic epilepsy [19].
Throughout the 1950s the work on EEGs expanded in many different places. During this time surgical operation for removing the epileptic foci became popular and the book entitled Epilepsy and the Functional Anatomy of the Human Brain (Penfiled and Jasper) was published. During this time microelectrodes were invented. They were made of metals such as tungsten or glass, filled with electrolytes such as potassium chloride, with diameters of less than 3 µm.
Depth electroencephalography of a human was first obtained with implanted intracerebral electrodes by Mayer and Hayne (1948). Invention of intracellular microelectrode technology revolutionized this method and was used in the spinal cord by Brock et al. in 1952 and in the cortex by Phillips in 1961.
Analysis of EEG signals started during the early days of EEG measurement. Berger assisted by Dietch (1932) applied Fourier analysis to EEG sequences, which was rapidly developed during the 1950s. Analysis of sleep disorders with EEGs started its development in the 1950s through the work of Kleitman at the University of Chicago.
In the 1960s analysis of the EEGs of full-term and premature newborns began its development [20]. Investigation of evoked potentials (EPs), especially visual EPs, as commonly used for monitoring mental illnesses, progressed during the 1970s.
The history of EEG, however, has been a continuous process, which started from the early 1300s and has brought daily development of clinical, experimental, and computational studies for discovery, recognition, diagnosis, and treatment of a vast number of neurological and physiological abnormalities of the brain and the rest of the central nervous system (CNS) of human beings. Nowadays, EEGs are recorded invasively and noninvasively using fully computerized systems. The EEG machines are equipped with many signal processing tools, delicate and accurate measurement electrodes, and enough memory for very long-term recordings of several hours. EEG or MEG (magnetoencephalogram) machines may be integrated with other neuroimaging systems such as functional magnetic resonance imaging (fMRI). Very delicate needle-type electrodes can also be used for recording the EEGs from over the cortex (electrocortiogram), and thereby avoid the attenuation and nonlinearity effects induced by the skull. The nature of neural activities within the human brain will be discribed next.
1.2 Neural Activities
The CNS generally consists of nerve cells and glia cells, which are located between neurons. Each nerve cell consists of axons, dendrites, and cell bodies. Nerve cells respond to stimuli and transmit information over long distances. A nerve cell body has a single nucleus and contains most of the nerve cell metabolism, especially that related to protein synthesis. The proteins created in the cell body are delivered to other parts of the nerve. An axon is a long cylinder, which transmits an electrical impulse and can be several metres long in vertebrates (giraffe axons go from the head to the tip of the spine). In humans the length can be a percentage of a millimetre to more than a metre. An axonal transport system for delivering proteins to the ends of the cell exists and the transport system has ‘molecular motors’, which ride upon tubulin rails.
Dendrites are connected to either the axons or dendrites of other cells and receive impulses from other nerves or relay the signals to other nerves. In the human brain each nerve is connected to approximately 10,000 other nerves, mostly through dendritic connections.
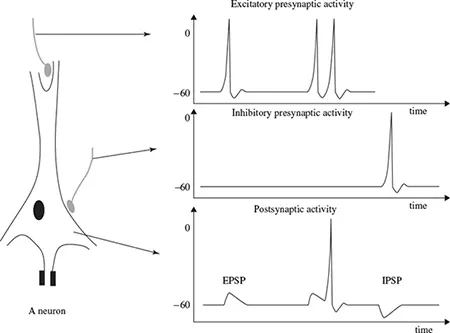
The activities in the CNS are mainly related to the synaptic currents transferred between the junctions (called synapses) of axons and dendrites, or dendrites and dendrites of cells. A potential of 60–70 mV with negative polarity may be recorded under the membrane of the cell body. This potential changes with variations in synaptic activities. If an action potential travels along the fibre, which ends in an excitatory synapse, an excitatory postsynaptic potential (EPSP) occurs in the following neuron. If two action potentials travel along the same fibre over a short distance, there will be a summation of EPSPs producing an action potential on the postsynaptic neuron providing a certain threshold of membrane potential is reached. If the fibre ends in an inhibitory synapse, then hyperpolarization will occur, indicating an inhibitory postsynaptic potential (IPSP) [21,22]. Figure 1.1 shows the above activities schematically.
Following the generation of an IPSP, there is an overflow of cations from the nerve cell or an inflow of anions into the nerve cell. This flow ultimately causes a change in potential along the nerve cell membrane. Primary transmembranous currents generate secondary inonal currents along the cell membranes in the intra- and extracellular space. The portion of these currents that flow through the extracellular space is directly responsible for the generation of field potentials. These field potentials, usually with less than 100 Hz frequency, are called EEGs when there are no changes in the signal average and DC if there are slow drifts in the average signals, which may mask the actual EEG signals. A combination of EEG and DC potentials is often observed for some abnormalities in the brain such as seizure (induced by pentylenetetrazol), hypercapnia, and asphyxia [23]. The focus will next be on the nature of active potentials.
Figure 1.1 The neuron membrane potential changes and current flow during synaptic activation recorded by means of intracellular microelectrodes. Action potentials in the excitatory and inhibitory presynaptic fibre respectively lead to EPSP and IPSP in the postsynaptic neuron
1.3 Action Potentials
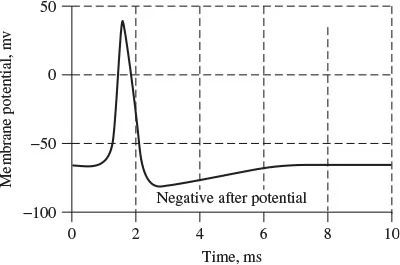
The information transmitted by a nerve is called an action potential (AP). APs are caused by an exchange of ions across the neuron membrane and an AP is a temporary change in the membrane potential that is transmitted along the axon. It is usually initiated in the cell body and normally travels in one direction. The membrane potential depolarizes (becomes more positive), producing a spike. After the peak of the spike the membrane repolarizes (becomes more negative). The potential becomes more negative than the resting potential and then returns to normal. The action potentials of most nerves last between 5 and 10 milliseconds. Figure 1.2 shows an example AP.
The conduction velocity of action potentials lies between 1 and 100 m/s. APs are initiated by many different types of stimuli; sensory nerves respond to many types of stimuli, such as chemical, light, electricity, pressure, touch, and stretching. On the other hand, the nerves within the CNS (brain and spinal cord) are mostly stimulated by chemical activity at synapses.
A stimulus must be above a threshold level to set off an AP. Very weak stimuli cause a small local electrical disturbance, but do not produce a transmitted AP. As soon as the stimulus strength goes above the threshold, an action potential appears and travels down the nerve.
Figure 1.2 An example action potential
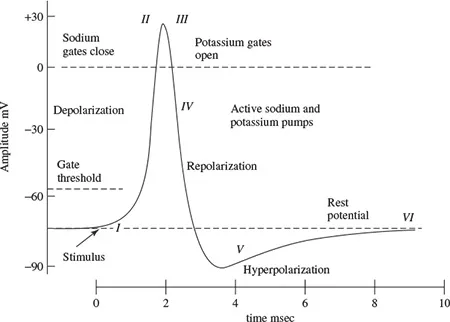
The spike of the AP is mainly caused by opening of Na (sodium) channels. The Na pump produces gradients of both Na and K (potassium) ions. Both are used to produce the action potential; Na is high outside the cell and low inside. Excitable cells have special Na and K channels with gates that open and close in response to the membrane voltage (voltage-gated channels). Opening the gates of Na channels allows Na to rush into the cell, carrying positive charge. This makes the membrane potential positive (depolarization), producing the spike. Figure 1.3 shows the stages of the process during evolution of an action potential for a giant squid. For a human being the amplitude of the AP ranges between approximately −60 mV and 10 mV. During this process [24]:
I. When the dendrites of a nerve cell receive the stimulus the Na+ channels will open. If the opening is sufficient to drive the interior potential from −70 mV up to −55 mV, the process continues.
II. As soon as the action threshold is reached, additional Na+ channels (sometimes called voltage-gated channels) open. The Na+ influx drives the interior of the cell membrane up to approximately +30 mV. The process to this point is called depolarization.
III. Then Na+ channels close and the K+ channels open. Since the K+ channels are much slower to open, the depolarization has time to be completed. Having both Na+ and K+ channels open at the same time would drive the system towards neutrality and prevent the creation of the action potential.
IV. Having the K+ channels open, the membrane begins to repolarize back towards its rest potential.
V. The repolarization typically overshoots the rest potential to a level of approximately −90 mV. This is called hyperpolarization and would seem to be counterproductive, but it is actually important in the transmission of information. Hyperpolarization prevents the neuron from receiving another stimulus during this time, or at least raises the threshold for any new stimulus. Part of the importance of hyperpolarization is in preventing any stimulus already sent up an axon from triggering another action potential in the opposite direction. In other words, hyperpolarization ensures that the signal is proceeding in one direction.
VI. After hyperpolarization, the Na+/K+ pumps eventually bring the membrane back to its resting state of −70 mV.
The nerve requires approximately two milliseconds before another stimulus is presented. During this time no AP can be generated. This is called the refractory period. The generation of EEG signals is next described.
Figure 1.3 Changing the membrane potential for a giant squid by closing the Na channels and opening K channels (adopted from Ka Xiong Charand [24])
1.4 EEG Generation
An EEG signal is a measurement of currents that flow during synaptic excitations of the dendrites of many pyramidal neurons in the cerebral cortex. When brain cells (neurons) are activated, the synaptic currents are produced within the dendrites. This current generates a magnetic field measurable by electro...