![]()
CHAPTER 1
Dates and Timing
The importance of dates and timing could not resonate more strongly than in the field of finance. From simple present value equations to more complex concepts such as yields and duration, time is an essential variable. Not surprisingly, dates and timing are also extremely important to cash flow modeling. Both dictate the core format of the model and permeate throughout many formulas and analyses.
For Excel-based modeling, dates and timing can be separated into their own individual categories. Dates are often in calendar format and widely used to initiate or terminate preplanned events such as rate step-ups, final maturity, and the like. Timing is typically represented in numerical format or a vector of numbers to control payment frequency and most analytics involving periodicity.
TIME PROGRESSION
Before jumping right to specific methods and examples, it is worth a few minutes to think about the structure of the transaction and whether to have time “progress” horizontally or vertically. The key to this decision is understanding Excel’s constraints within the context of the necessary payment frequency and overall length of the analysis. The designers of Excel limited the number of rows to 65,556 and columns to 256. If a transaction required modeling quarterly over a period of 25 years, it would not matter whether the payments move horizontally or vertically because only 100 (4 payments per year * 25 years = 100) columns or rows would be needed. However, if for some reason the frequency had to be switched to monthly, the payments would have to move vertically because 300 columns (12 payments per year * 25 years = 300) would exceed Excel’s column constraint (see Figure 1.1).2
While it is generally recommended to have time progressing in the same direction through all sections of the model, a sheet will be required to have time progressing in an alternate direction in some instances. There are a number of methods to transpose data in Excel, but many can be problematic when it comes time to refresh data or time consuming to implement. The best method is to use Excel’s OFFSET function, which is described in Chapter 2’s Toolbox.
FIGURE 1.1 Notice that there are only 256 columns on a sheet, ending with column IV.
DATES AND TIMING ON THE INPUTS SHEET
Regardless of the type of transaction, the dates and timing section of the Inputs sheet at bare minimum consist of two dates and two timing inputs. The first of the two minimum dates is the closing date. This date is the day that the deal closes and funds have been issued. Many timing factors initiate off this date such as fees and interest charges, asset lives, and so on. The second date that is close in time to the closing date is the first payment date. This is the date that the first payments of fees, interest, and principal are due. It is important to distinguish between these two dates as many transactions have first payment dates that are irregularly spaced between closing. This means that the initial period could have a partial month’s payment requirement, which can only be calculated if both the closing date and the first payment date are inputted.
The two absolute necessities for timing are actually one concept, payment frequency . Payment frequency is an integer or fraction representing the time difference between payment dates. There are many possibilities for representing how often a transaction pays, but conventionally time is “represented” in years, which can be parsed into 2 for semiannual pay, 4 for quarterly pay, and 12 for monthly pay. However, it is extremely important to understand that time can sometimes be “measured” more accurately on a daily basis for the purpose of calculating payment amounts. This difference occurs because in finance the same months do not always have the same number of days in them depending on the day-count system used.
DAY-COUNT SYSTEMS: 30/360 VERSUS ACTUAL/360 VERSUS ACTUAL/365
Day-count systems evolved due to the nuances of the Gregorian calendar (i.e., different numbers of days in certain months and leap years). The 30/360-day-count system simplifies the annual calendar by assuming there are 12 months with 30 days each, for a total of 360 days. Payment frequency is then every 30 days per month, 90 days per quarter, 180 days per semiannual, and so on. The 30/360 system is the most common in the United States because it is used for most municipal, corporate, and agency bonds, mortgage-backed securities, and many other types of notes and certificates.
Working with the 30/360-day-count system is made very easy in Excel, thanks to the DAYS360 function. This function requires three inputs: a start date, an end date, and a method.
= DAYS360(start date, end date, method)
The start date is the first date to begin counting the days in between, the end date is the date to count the days up to, and finally the method is FALSE if the day count system desired is the U.S./National Association of Securities Dealers (NASD) system or TRUE if the system is European. The subtle difference between the two systems is that the U.S. system’s starting date becomes equal to the 30th of the start month if the starting date is actually the 31st of that month. For the ending date, if it lands on the 31st of a month and the starting date is before the 30th of a month, the ending date become the 1st of the next month. However, if the start date is the 31st of a month, the ending date becomes equal to the 30th of the same ending date month. The European system is much simpler. If the starting or ending date lands on the 31st, the date just becomes the 30th of that month. The more common of the two is the U.S. system, which is the default method if a TRUE or FALSE is omitted.
Another popular day-count system is actual/360, which is primarily used for money market securities and U.S. Treasury bills. This system calculates an interest period as the actual number of days between two dates. It is important to note that to represent the day difference as a fraction of a year, the denominator uses 360 days, rather than 365. Since the natural format for dates in Excel are serial numbers, beginning with 1 for January 1, 1900, the actual difference between two dates can be calculated by subtracting the beginning date from the end date.
The final day-count system used is actual/365 or actual/actual. Created to be as realistic to a year as possible, the calculation is virtually identical to actual/360, but instead of a year having 360 days it has 365.
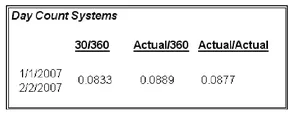
An example of the differing date-count systems and their respective fractions of a year can be seen in Figure 1.2. While a few hundredths of a percent does not seem like much of a difference, this can be tens of thousands of dollars on deals in the hundred millions or billions of dollars.
FIGURE 1.2 A different fraction of time exists for the period January 1, 2007 to February 1, 2007 depending on the day-count system used.
MODEL BUILDER 1.1: INPUTS SHEET—DATES AND TIMING
As this book suggested, the reader can develop a cash flow model from an entirely blank workbook. This Model Builder section begins with the assumption that the reader is staring at Sheet1 of a blank workbook in Excel. This first Model Builder exercise introduces basic labels and the fundamental date and timing inputs.
Keep in mind two minor details while trying to follow the Model Builder section. The first detail is formatting. The most important formatting concept to remember is to format a cell with the correct data format. Many cells have different data formats such as dates, numerical values, text, and the like. If a number is appearing instead of a date, it could mean that the format for that cell is set to number and should be changed to date. Be mindful of cell data formats.
Another detail is the color scheme that has been used. Not only does it make the model more professional looking, but grouping related sections together by color makes it easier to read. There are no specific instructions on formatting, but it is very useful to have a well-formatted model.
If there is any question as to what a completed section or formula should look like, each Model Builder section (along with a completed Project Model) can be found on the CD-ROM that comes with this book. Otherwise the first Model Builder begins with:
1. When Microsoft Excel is first opened most systems’ default layout is to begin with three worksheets labeled Sheet1, Sheet2, and Sheet3. The first Model Builder exercise requires two worksheets. The worksheet tabs should be renamed from Sheet1 and Sheet2 to Inputs and Hidden, respectively.
2. Instead of beginning on column A, this column should be adjusted to a width of 1.0. The reason for this is readability, since some formatting can be cut off by the edge of the screen. With column A adjusted, move to cell B1 and enter,
Project Model Builder. Make sure to change the font to blue and bold. In most financial models assumptions that are variables to be altered are denoted in bold blue font. This cell should be named
ProjName. If naming cells is unclear, jump ahead to the Toolbox section at the end of this chapter.
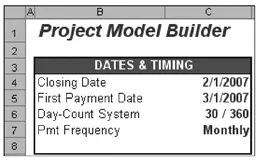
FIGURE 1.3 Basic inputs for dates and timing.
3. Moving under the transaction name in cell B3, input the title Dates & Timing. Now starting in cell B4 and continuing through to cell B7, enter the following text into the cells respectively: Closing Date, First Payment Date, Day-Count System, and Pmt Frequency. Highlight cells B3:C8 and format the area with a border. At this point, aside from stylistic preference, the upper corner of the Inputs sheet should look like Figure 1.3.
4. Before filling in starting values for the dates and timing inputs, switch over to the Hidden sheet to create data validation lists. The first one that will be needed is the day-count system. Input Day-Count System into cell A5 as a header. The list will start in cell A6 with the first type of day-count system that can be activated, cell A7 with the second, and so on. For this model input 30 / 360 into cell A6, Actual / 360 into cell A7, and Actual / 365 into cell A8. Highlight A6:A8 and name the range lstDayCountSys.
5. Similarly, it is inefficient to constantly enter what type of payment frequency ther...