This multi-disciplined text covers the fundamentals as well as recent advance in this topic, providing need-to-know information for researchers in many disciplines including pharmaceutical, environmental and biomedical analysis who are utilizing mass spectrometry
eBook - ePub
Introduction to Mass Spectrometry
Instrumentation, Applications, and Strategies for Data Interpretation
- English
- ePUB (mobile friendly)
- Available on iOS & Android
eBook - ePub
Introduction to Mass Spectrometry
Instrumentation, Applications, and Strategies for Data Interpretation
About this book
Completely revised and updated, this text provides an easy-to-read guide to the concept of mass spectrometry and demonstrates its potential and limitations. Written by internationally recognised experts and utilising "real life" examples of analyses and applications, the book presents real cases of qualitative and quantitative applications of mass spectrometry. Unlike other mass spectrometry texts, this comprehensive reference provides systematic descriptions of the various types of mass analysers and ionisation, along with corresponding strategies for interpretation of data. The book concludes with a comprehensive 3000 references.
Trusted by 375,005 students
Access to over 1.5 million titles for a fair monthly price.
Study more efficiently using our study tools.
Information
“I feel sure that there are many problems in Chemistry which could be solved with far greater ease by the application of Positive Rays to chemical analysis than by any other method.”
~Joseph John Thomson
Chapter 1
Introduction
I. Introduction
1. The Tools and Data of Mass Spectrometry
2. The Concept of Mass Spectrometry
II. History
III. Some Important Terminology Used in Mass Spectrometry
1. Introduction
2. Ions
3. Peaks
4. Resolution and Resolving Power
IV. Applications
1. Example 1-1: Interpretation of Fragmentation Patterns (Mass Spectra) to Distinguish Positional Isomers
2. Example 1-2: Drug Overdose: Use of GC/MS to Identify a Drug Metabolite
3. Example 1-3: Verification that the Proper Derivative of the Compound of Interest Has Been Prepared
4. Example 1-4: Use of a CI Mass Spectrum to Complement an EI Mass Spectrum
5. Example 1-5: Use of Exact Mass Measurements to Identify Analytes According to Elemental Composition
6. Example 1-6: Is This Protein Phosphorylated? If So, Where?
7. Example 1-7: Clinical Diagnostic Tests Based on Quantitation of Stable Isotopes by Mass Spectrometry in Lieu of Radioactivity
V. The Need for Chromatography
VI. Closing Remarks
VII. Monographs on Mass Spectrometry Published Before 1970
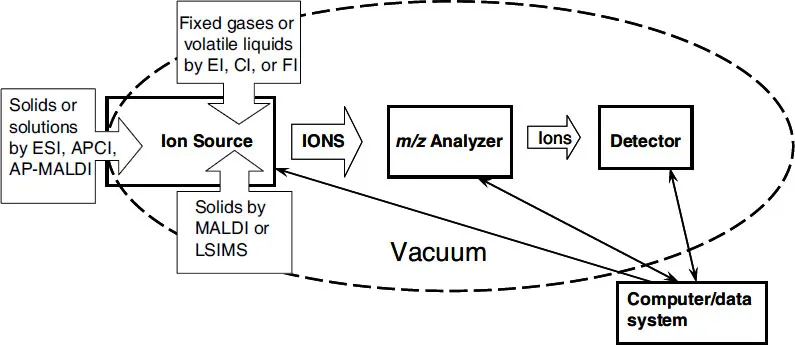
Figure 1-1. This conceptual illustration of the mass spectrometer shows the major components of mass spectrometer, i.e., sample inlets (dependent on sample and ionization technique; ion source (origin of gas phase ions); m/z analyzer (portion of instrument responsible for separation of ions according to their individual m/z values); detector (generates the signals that are a recording of the m/z values and abundances of the ions); vacuum system (the components that remove molecules, thereby providing a collision-free path for the ions from the ion source to the detector); and the computer (coordinates the functions of the individual components and records and stores the data).
I. Introduction
Mass spectrometry is a microanalytical technique that can be used selectively to detect and determine the amount of a given analyte. Mass spectrometry is also used to determine the elemental composition and some aspects of the molecular structure of an analyte. These tasks are accomplished through the experimental measurement of the mass of gas-phase ions produced from molecules of an analyte. Unique features of mass spectrometry include its capacity for direct determination of the nominal mass (and in some cases, the molar mass) of an analyte, and to produce and detect fragments of the molecule that correspond to discrete groups of atoms of different elements that reveal structural features. Mass spectrometry has the capacity to generate more structural information per unit quantity of an analyte than can be determined by any other analytical technique.
Much of mass spectrometry concerns itself with the mass of the isotopes of the elements, not the atomic mass1 of the elements. The atomic mass of an element is the weighted average of the naturally occurring stable isotopes that comprise the element. Mass spectrometry does not directly determine mass; it determines the mass-to-charge ratio (m/z) of ions. More detailed explanations of atomic mass and mass-to-charge ratios follow in this chapter.
It is a fundamental requirement of mass spectrometry that the ions be in the gas phase before they can be separated according to their individual m/z values and detected. Prior to 1970, only analytes having significant vapor pressure were amenable to mass spectrometry because gas-phase ions could only be produced from gas-phase molecules by the techniques of electron ionization (EI) or chemical ionization (CI). Nonvolatile and thermally labile molecules were not amenable to these otherwise still-valuable gas-phase ionization techniques. EI (Chapter 6) and CI (Chapter 7) continue to play very important roles in the combined techniques of gas chromatography/mass spectrometry (GC/MS, Chapter 10) and liquid chromatography/mass spectrometry (LC/MS, Chapter 11). After 1970, the capabilities of mass spectrometry were expanded by the development of desorption/ionization (D/I) techniques, the generic process of generating gas-phase ions directly from a sample in the condensed phase. The first viable and widely accepted technique2 for D/I was fast atom bombardment (FAB), which required nanomoles of analyte to produce an interpretable mass spectrum. During the 1980s, electrospray ionization (ESI) and matrix-assisted laser desorption/ionization (MALDI) eclipsed FAB, in part because they required only picomoles of analyte for analysis. ESI and MALDI are mainly responsible for the dominant role of mass spectrometry in the biological sciences today because they are suitable for analysis of femtomole quantities of thermally labile and nonvolatile analytes; therefore, a chapter is devoted to each of these techniques (Chapters 8 and 9).
Mass spectrometry is not limited to analyses of organic molecules; it can be used for the detection of any element that can be ionized. For example, mass spectrometry can analyze silicon wafers to determine the presence of lead and iron, either of which can cause failure of a semiconductor for microprocessors; similarly, drinking water can be analyzed for arsenic, which may have health ramifications. Mass spectrometry is extensively used in geology and material sciences. Each of these two disciplines has developed unique analytical capabilities for the mass spectrometer: isotope ratio mass spectrometry (IRMS) in geology and secondary ion mass spectrometry (SIMS) in material sciences. Both of these techniques, along with the analysis of inorganic ions, are beyond the scope of this present book, which concentrates on the mass spectrometry of organic substances.
1. The Tools and Data of Mass Spectrometry
The tools of mass spectrometry are mass spectrometers, and the data are mass spectra. Figure 1-1 is a conceptual representation of a mass spectrometer. Each of the individual components of the instrument will be covered at logical stages throughout this book. Figure 1-2 depicts the three ways of displaying the data recorded by the mass spectrometer. The acquired mass spectra can be displayed in many different ways, which allow the desired information about the analyte to be easily extracted. These various techniques for data display and their utility are covered later in this chapter.
2. The Concept of Mass Spectrometry
Ions are charged particles and, as such, their position in space can be manipulated with the use of electric and magnetic fields. When only individual ions are present, they can be grouped according to their unique properties (mass and the number of charges) and moved from one point to another. In order to have individual ions free from any other forms of matter, it is necessary to analyze them in a vacuum. This means that the ions must be in the gas phase. Mass spectrometry takes advantage of ions in the gas phase at low pressures to separate and detect them according to their mass-to-charge ratio (m/z) – the mass of the ion on the atomic scale divided by the number of charges that the ion possesses. This definition of the term m/z is important to an understanding of mass spectrometry. It should be noted that the m/z value is a dimensionless number. The m/z term is always used as an adjective; e.g., the ions with m/z 256, or the ion has an m/z value of 256. A recording of the number of ions (abundance) of a given m/z value as a function of the m/z value is a mass spectrum. Only ions are detected in mass spectrometry. Any particles that are not ionic (molecules or radicals3) are removed from the mass spectrometer by the continuous pumping that maintains the vacuum.
The mass component that makes up the dimensionless m/z unit is based on an atomic scale rather than the physical scale normally considered as mass. Whereas the mass physical scale is defined as one kilogram being the mass of one liter of water at a specific temperature and pressure, the atomic mass scale is defined based on a fraction of a specific isotope of carbon; i.e., 1 mass unit on an atomic scale is equal to 1/12 the mass of the most abundant naturally occurring stable isotope of carbon, 12C. This definition of mass, as represented by the symbol u, which is synonymous with dalton (Da), will be used throughout this book [1].
A previous standard for the atomic mass unit was established in chemistry in 1905 (based on the earlier suggestion of the Belgium chemist, Jean Servais Stas, 1813–1891) when it was agreed that all masses would be relative to the atomic mass of oxygen. This later became known as the “chemistry mass scale”. By setting the atomic mass of oxygen to an absolute value of 16, it was relatively easy to determine the atomic mass of new elements (in the form of their oxides) as they were discovered. Francis William Aston (British physicist and 1922 chemistry Nobel laureate for the development of the mass spectrograph and the measurement of the nuclides of the elements, 1877–1945) realized that the “chemistry mass scale” was not usable with his mass spectrograph (a device used to determine the existence of individual isotopes of the elements) because, rather than dealing with the atomic mass of elements, he was measuring the mass of individual isotopes, and oxygen had three naturally occurring stable isotopes, the most abundant of which accounted for only 99.76%. Therefore, ca. 1920, Aston established the “physics mass scale” by declaring the exact mass of the most abundant stable isotope of oxygen, 16O, to be 16. This meant that there were now two different definitions for the atomic mass unit (amu). In one case, 1 amu was equal to 1/16 the mass of 16O (the physics mass scale) and, in the second case, 1 amu was 1/16 the weighted average of the three naturally occurring isotopes of oxygen [1]. The amu on the physics mass scale was a factor of 1.000275 greater than that on the chemistry mass scale. This created confusion. Based on the 1957 independent recommendations of D. A. Ölander and A. O. Nier, the International Union of Physicists at Ottawa in 1960 and the International Union of Chemists at Montreal in 1961 adopted the carbon-12 standard, which, as stated above, establishes a single unified atomic mass unit (u) as 1/12 the most abundant naturally occurring stable isotope of carbon (12C). At the same time, to keep from having three different values associated with the amu term, the symbol for the unified atomic mass unit was established as u [1]. Unfortunately, an atomic mass unit based on carbon-12 is incorrectly assigned the amu symbol in many textbooks with current copyright dates.
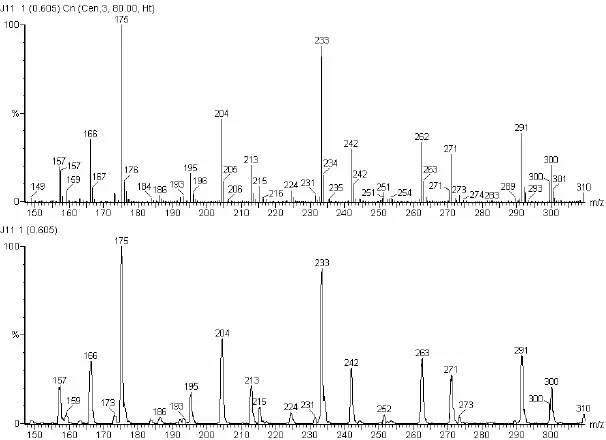
Figure 1-2. The top part of this figure is a bar-graph presentation of a mass spectrum; this is the presentation most often used for data acquired by GC/MS. The middle display is the same mass spectrum presented in profile mode; this type of display is often used with LC/MS data because the mass spectral peaks represent ions of different m/z values that may not be well resolved by the mass spectrometer, such as is sometimes the case with multiple-charge data. The third way spectra are displayed is in a tabular format (not shown). The tabular format is a listing of pairs of m/z values and intensities. Often mass spectral peaks of significant intensity are observed in the tabular display, but not in a graphical display because of its limited resolution. The graphical displays provide the general mass spectral image of the analyte; the tabular display provides the mass spectral details.
Another symbol used for the un...
Table of contents
- Cover
- Contents
- Title Page
- Copyright
- Preface
- Acknowledgments
- Chapter 1: Introduction
- Chapter 2: The Mass Spectrometer
- Chapter 3: Mass Spectrometry/Mass Spectrometry
- Chapter 4: Inlet Systems
- Chapter 5: Strategies for Data Interpretation (Other than Fragmentation)
- Chapter 6: Electron Ionization
- Chapter 7: Chemical Ionization
- Chapter 8: Electrospray Ionization
- Chapter 9: MALDI
- Chapter 10: Gas Chromatography/Mass Spectrometry
- Chapter 11: Liquid Chromatography/Mass Spectrometry
- Chapter 12: Analysis of Proteins and Other Biopolymers
- Subject Index
- Abbreviations
Frequently asked questions
Yes, you can cancel anytime from the Subscription tab in your account settings on the Perlego website. Your subscription will stay active until the end of your current billing period. Learn how to cancel your subscription
No, books cannot be downloaded as external files, such as PDFs, for use outside of Perlego. However, you can download books within the Perlego app for offline reading on mobile or tablet. Learn how to download books offline
Perlego offers two plans: Essential and Complete
- Essential is ideal for learners and professionals who enjoy exploring a wide range of subjects. Access the Essential Library with 800,000+ trusted titles and best-sellers across business, personal growth, and the humanities. Includes unlimited reading time and Standard Read Aloud voice.
- Complete: Perfect for advanced learners and researchers needing full, unrestricted access. Unlock 1.5M+ books across hundreds of subjects, including academic and specialized titles. The Complete Plan also includes advanced features like Premium Read Aloud and Research Assistant.
We are an online textbook subscription service, where you can get access to an entire online library for less than the price of a single book per month. With over 1.5 million books across 990+ topics, we’ve got you covered! Learn about our mission
Look out for the read-aloud symbol on your next book to see if you can listen to it. The read-aloud tool reads text aloud for you, highlighting the text as it is being read. You can pause it, speed it up and slow it down. Learn more about Read Aloud
Yes! You can use the Perlego app on both iOS and Android devices to read anytime, anywhere — even offline. Perfect for commutes or when you’re on the go.
Please note we cannot support devices running on iOS 13 and Android 7 or earlier. Learn more about using the app
Please note we cannot support devices running on iOS 13 and Android 7 or earlier. Learn more about using the app
Yes, you can access Introduction to Mass Spectrometry by J. Throck Watson,O. David Sparkman in PDF and/or ePUB format, as well as other popular books in Physical Sciences & Spectroscopy & Spectrum Analysis. We have over 1.5 million books available in our catalogue for you to explore.