The Bloomberg Market Essentials: Technical Analysis series covers the key elements of the most widely used technical analysis tools. Using these fast-track resources, traders can come up to speed quickly on each method—what it is, how it works, and how to use it.
The third book in this series, Chart Patterns, gives traders the first step toward applying one of the oldest and most widely used tools in the market. Flags, head-and-shoulders patterns, double bottoms, and more are detailed to help the trader know when a breakout is coming or when a trend is continuing.
Bruce Kamich is a highly respected voice in the technical analysis community, coauthoring the widely read Morgan Stanley Smith Barney Daily Technical Market Letter publication.
eBook - ePub
Chart Patterns
About this book
Trusted by 375,005 students
Access to over 1.5 million titles for a fair monthly price.
Study more efficiently using our study tools.
Information
CHAPTER 1
Why Study Patterns?
INVESTORS HAVE THE USE of many sophisticated tools to conduct research, trade, invest, track, and follow their holdings, and, of course, rebalance and maintain their investments. Why devote time and effort to study subjective and arcane chart patterns when high-powered methods of analysis, neural networks, and computer programs can pick stocks?
There are several reasons to study chart patterns. The first and probably most important one is that I and many other analysts and traders have found that these patterns cannot be random. I have been looking at charts of stock prices, commodities, and interest rates since the late 1960s. I believe that these patterns I have learned to recognize are the result of some very human behavior and not just “noise.” These patterns repeat, just as history does. The human race has grown more intelligent and can process more and more information, but basic human nature has remained the same over the centuries. History is a reflection of and results from human nature—and price history is no different. When the stock market melted down in 2008, quantitative analysts and technical analysts looked back in history to find comparable periods: 1987, 1929, and even 1907 were brought out from the archives of charts and statistics.
Not convinced that human nature has been unchanged for centuries? Think about the stories in the Bible that keep repeating themselves thousands of years later, such as the struggle between brothers for the family inheritance, a woman wanting to be a mother, or a people who are enslaved—stories of greed, hope, and redemption. Or think about those famous Greek tragedies that seem to be playing out again in contemporary real life. The plays by William Shakespeare are hundreds of years old, yet the characters and plots are timeless. Isn’t it amazing that these plays are still understood and people can relate to them today?
In 2007, the same old human emotion—greed—played a part in the markets, with private equity funds and hedge funds dominating the markets. And what about the stories of seemingly unlimited demand in China for goods and services ahead of the Olympics, and new stock market listings in Asia soaring to the stratosphere? Greed seemed to play a part again in the crude oil futures market as prices approached $147 per barrel and forecasters predicted $200, $250, and even $400 per barrel. The top in the U.S. stock market in 2007 was similar to the dot-com greed at the top in late 1999 and early 2000. Remember the summer of 2005? It seemed like nearly everyone from coast to coast and border to border was caught up in the ever-climbing real estate market. If one traveled overseas or looked at the “international listings” of real estate for sale, then one could see that the market for hot properties had gone global. In the first quarter of 2008, we witnessed fear as parts of the equity and credit markets plunged relentlessly into lows in January, and then again in March as the Wall Street firm Bear Stearns imploded. (See the Dow Jones Industrial Average index in Figure 1.1.)
Margin call liquidation, outright selling and fear of continuing losses drove the market down with only limited and temporary bounce-backs.
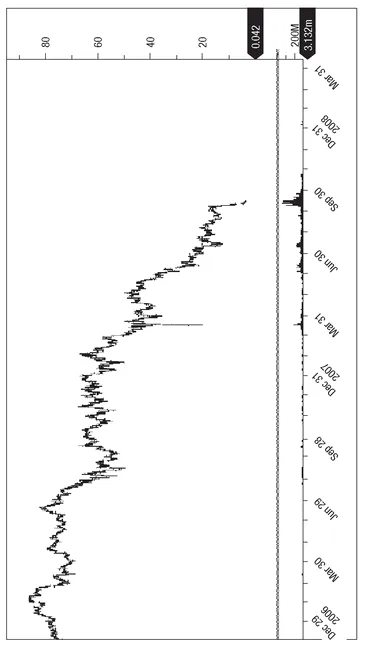
The end of Lehman Brothers shook people further, and the after-shocks continue to ripple around the world (see the Dow Jones Industrial Average index in Figure 1.2). Notice in Figure 1.3 how quickly prices plunged after the loss of Lehman.
Prices sank to even lower in late 2008, with hedge funds imploding and people fearing a depression on the magnitude of the 1930s as stocks failed to hold at 10,000, and then 9,000 on the Dow.
The academic financial community has believed in the random walk theory since the early 1960s and has studies to support its theory, but more recent analyses of market data are increasingly pointing to an opposite conclusion. Professor Andrew Lo at the Sloan School of Management at the Massachusetts Institute of Technology has done extensive research into stock market behavior, which has shaken the pillars of the random walk and the efficient market belief system.1 Another milestone in research supporting technical analysis was a paper by Dr. Carol Osler, now at Brandeis University, that was written while she was with the Research and Market Analysis Group of the Federal Reserve Bank of New York.2 The abstract for the paper states, in part:
This paper evaluates rigorously the predictive power of the head-and-shoulders pattern as applied to daily exchange rates. Though such visual, nonlinear chart patterns are applied frequently by technical analysts, our paper is one of the first to evaluate the predictive power of such patterns.
FIGURE 1.1The Dow Jones Industrial Average slid from October 2007 to March 2008.
Source: Bloomberg
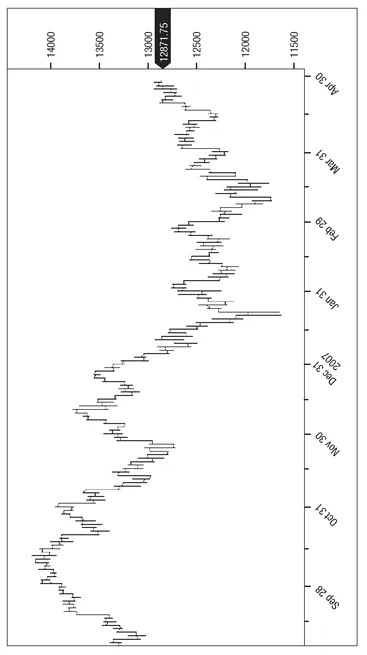
FIGURE 1.2 Dow Jones Industrial Average slide, October 2007-December 2008
Source: Bloomberg
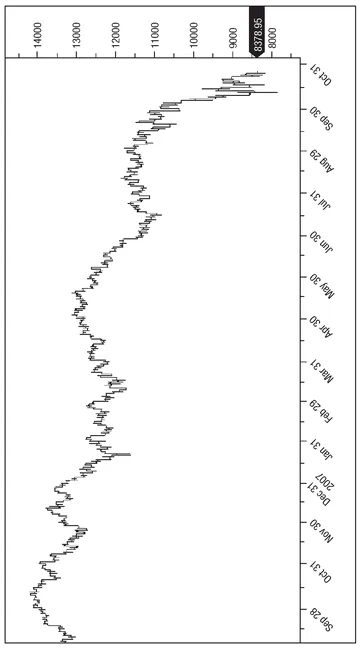
FIGURE 1.3 The slide in the price of Lehman Brothers was relentless.
Source: Bloomberg
Results:
... If one had speculated in all six currencies simultaneously, profits would have been both statistically and economically significant.
In midtown Manhattan, in Greenwich, Connecticut, and in other financial centers, legions of MBAs sit in front of computer terminals armed with algorithms and models to trade the markets, but can they “read” and anticipate the markets? Maybe. Can they judge one stock versus others? Perhaps. Can they understand the “personality” of the market that comes through the chart? I don’t think so. There are many things that can influence stock prices, but many of them cannot be quantified—for example, an evaluation of management, market sentiment, and sociological and psychological factors. The more you look at factors that cannot be nailed down by hard numbers, the more you should look at the chart of the stock. The chart of the stock, index, or commodity reflects everyone’s opinion about all factors—ones we can and cannot quantify. But the stock chart also gives a complete picture of a company’s price history over any number of time spans. The chartist or technical analyst can see all this history at a glance. Can these bright graduates read beyond what they believe they can model? Do they ever get a “feel” for the markets and seem to be totally in sync like an athlete in “the zone”? At times, an accomplished chart reader can have a sixth sense about future price movements, just like an athlete who can sense an opponent’s next move. Given the right math skills or computer programming background, pretty much anyone can build a trading model. If a new variable comes along, or if the importance of an old variable changes, the model probably won’t adapt and will have to be refitted at some point. In an interview in the January 2009 issue of Bloomberg Markets, billionaire investor Wilbur Ross notes that computer risk models cannot replace good old real-world knowledge: “I think the real thing is not to confuse paper with what’s the real world.” You can’t get more real than today’s stock price.
The basic purpose of chart reading is to see the past history of a stock, judge the probable strength of demand and supply at various price levels, and predict the direction of prices. The clues to a stock’s movement are recorded on the chart if one takes the time to learn them. When new variables come along, they show up in the price action right away; there is no need to go back and change formulas. I have a book in my office about neural networks with the subtitle Gaining Predictive Edge in the Market.3 With nonlinear methods entrenched for more than a decade, the new edge in predicting and trading the markets should circle back to the early days of charting.
With so many traders and so much money going toward black-box systems and sophisticated math-driven programs to get their “edge,” one can easily believe that the real edge is now reverting back, in part, to the “old-school ways” that Wilbur Ross might endorse. One can easily see the bias toward indicators, math and back testing by the kinds of articles in the popular industry magazines, the seminars for the public, and various webinars today. I find it interesting that in other areas of life, there is a return by successful practitioners to the older, hands-on methods of doing things. For example, artists in the kitchen have returned to old ways of cooking, baking and preparing food in reaction to the mass-produced and heavily processed foods of today. A number of the popular chefs today have spent time learning from authentic cooks and butchers in Tuscany or in small villages in France, for example. The New York Times “Dining & Wine” section has reported on artists’ collectives in Brooklyn, New York, where people are making pickles, cheeses and chocolates by hand. There are a number of art colonies around the country where you can find craftspeople returning to their roots or their grandparents’ roots to make musical instruments, furniture, rugs, and even canoes.
Chart reading takes a bit of intuition and the belief that these patterns actually work. This belief should be based on experience; seeing these patterns work in real time is learning by example. In my undergraduate course on technical analysis, I make all my students maintain a bar chart of a stock every day for the semester. The personal construction of a chart keeps them in touch with the market’s fluctuations and can convince them in real time that formations like flags and pennants really work, although this may need to be pointed out to them the first few times.
Intuition isn’t something one can teach, but the prepared mind can be trained to be more intuitive. By looking at enough charts and patterns, my students become like the original ticker tape watchers back in the early 1900s who could not escape the tape. Traders eighty years ago studied the bid or offer quote for each security they followed and the tape action with the volume behind each trade. These tape watchers could sense when a stock was under accumulation. They looked for a stock that rallied on one thousand shares and fell on a few hundred. Seeing a stock advance on increased volume and decline on lighter volume is how tape readers decided on what stocks to buy. Retail traders were still reading the tape in the 1960s and early 1970s, but tape watchers drifted away from the boardrooms of brokerage houses when someone decided the ticker tape was an unnecessary expense. When the ticker tape disappeared, the account executives (as they were called back then) got the New York Stock Exchange tape streaming on their desktops. Because professional money management has replaced individual stock picking, account executives have become advisers, and the advice has changed.
Although the tape can still be seen on CNBC or Bloomberg Television, the skills of the tape reader have disappeared. Some day-trading firms have tried to bring this skill back with the detailed reading of market-maker quotes. When everyone else in your firm or on the Street is programming and searching on a computer for patterns and intermarket relationships in the data, and they get away from seeing patterns, a return to this approach could give you a real edge. Today, more than ever, I believe the person who can look at the market in the old way can learn to outperform others in this formula-driven market.
It may seem strange, but observing is really a skill to be developed and honed with experience. Law officers, doctors and others are often trained to be better observers. The experienced, senior police officers in each precinct teach the rookies on the job to study people and size up situations. Teaching hospitals do, in fact, teach interns to look at the patient and observe subtle details in skin and nail color, reflexes, and so on, in addition to running all those annoying and expensive tests. Experience on the job will also teach most people more than what can come from textbooks and the classroom. So why not Wall Street traders? Empirical experience is better, in my opinion, than browsing the Internet or using pattern-recognition software or some database of patterns. By looking at more and more charts, training your eyes to identify the patterns, and subsequently seeing what develops, you can cultivate the skill and art of chart reading. Finding a confusing or questionable pattern and discussing it with a more experienced chart reader or technical mentor should also help the process. The technical analysts who were at the top of their game in the 1970s and 1980s had spent many years looking at charts and developing indicators by hand. Keeping advance-decline data and hundreds of charts up to date with a No. 2 pencil day after day gives a depth of experience that you don’t get from preloaded software and spreadsheets. Natural talent always helps, but expertise in any field comes with a significant amount of hard work. Successful chart reading should be no different.
From my experience, the financial press doesn’t really know about, doesn’t recognize, and certainly doesn’t respect, chart patterns or, for that matter, the broader subject of technical analysis. Financial reporters and their editors need a basic fundamental story today to explain today’s price movements—never understanding that prices discount events and people anticipate the news very often. A good reporter may actually put his finger on some piece of news that some investors may be focused on today, but he or she may not touch on factors that might be in the back of investors’ minds, or on their fears or hopes, which also move prices. Investors are human and not totally rational when it comes to the buying and selling of securities and other products. We think we may know what moves markets and people, but as Richard W Schabacker said in the preface to his book Stock Market Theory and Practice (New York: B.C. Forbes Publishing Company, 1930), “of paramount importance, however, for our own consideration, is the ultimate fact that no adviser, no theory, no amount of experience, can approach infallibility.” And this seems very true nearly eighty years later: knowing chart patterns in addition to all the tools you may have learned in graduate school gives you an edge, because only a handful of schools and instructors have been brave enough to teach technical analysis. With technical analysis being taught in perhaps only twenty or so schools across the United States and Canada, you can feel pretty confident that thousands of newly minted finance majors and MBAs are not trading with the added information gained from charts.
Charts patterns have fanciful, unscientific names, but you shouldn’t be confused or put off by technical analysis jargon, such as head and shoulders, double tops, triangles, and island reversal patterns. All of these patterns—in fact, all patterns—are based on the simpl...
Table of contents
- Praise
- Title Page
- Copyright Page
- Dedication
- Acknowledgements
- Introduction
- CHAPTER 1 - Why Study Patterns?
- CHAPTER 2 - The Past 1910-1960
- CHAPTER 3 - The Present
- CHAPTER 4 - Major Tops
- CHAPTER 5 - Major Bottoms
- CHAPTER 6 - Triangles, Boxes, and Rectangles
- CHAPTER 7 - Flags
- CHAPTER 8 - Pennants
- CHAPTER 9 - Wedges
- CHAPTER 10 - Odds and Sods
- CHAPTER 11 - Keep Your Seat Belts Fastened Reversals Ahead
- CHAPTER 12 - Gaps
- CHAPTER 13 - The Future of Chart Patterns
- Index
- About the Author
- About Bloomberg
Frequently asked questions
Yes, you can cancel anytime from the Subscription tab in your account settings on the Perlego website. Your subscription will stay active until the end of your current billing period. Learn how to cancel your subscription
No, books cannot be downloaded as external files, such as PDFs, for use outside of Perlego. However, you can download books within the Perlego app for offline reading on mobile or tablet. Learn how to download books offline
Perlego offers two plans: Essential and Complete
- Essential is ideal for learners and professionals who enjoy exploring a wide range of subjects. Access the Essential Library with 800,000+ trusted titles and best-sellers across business, personal growth, and the humanities. Includes unlimited reading time and Standard Read Aloud voice.
- Complete: Perfect for advanced learners and researchers needing full, unrestricted access. Unlock 1.5M+ books across hundreds of subjects, including academic and specialized titles. The Complete Plan also includes advanced features like Premium Read Aloud and Research Assistant.
We are an online textbook subscription service, where you can get access to an entire online library for less than the price of a single book per month. With over 1.5 million books across 990+ topics, we’ve got you covered! Learn about our mission
Look out for the read-aloud symbol on your next book to see if you can listen to it. The read-aloud tool reads text aloud for you, highlighting the text as it is being read. You can pause it, speed it up and slow it down. Learn more about Read Aloud
Yes! You can use the Perlego app on both iOS and Android devices to read anytime, anywhere — even offline. Perfect for commutes or when you’re on the go.
Please note we cannot support devices running on iOS 13 and Android 7 or earlier. Learn more about using the app
Please note we cannot support devices running on iOS 13 and Android 7 or earlier. Learn more about using the app
Yes, you can access Chart Patterns by Bruce M. Kamich in PDF and/or ePUB format, as well as other popular books in Business & Investments & Securities. We have over 1.5 million books available in our catalogue for you to explore.