![]()
Section 1
Monitoring the Global Carbon Cycle: A Tribute to David Keeling
The CO2 concentration of our atmosphere is increasing. This fact was detected by Charles David Keeling after he designed and deployed his program of CO2 measurements at Mauna Loa and Antarctica in the 1950s. These measurements continue to this day in collaboration with the National Oceanic and Atmospheric Administration. Their cumulative display—updated regularly—is often known as the Keeling Curve. More than any other scientific record, this graph has motivated the growing level of public concern that has now made carbon sequestration a commonly-known concept. Can carbon sequestration help reverse the trend shown in the Keeling Curve? The challenge of this question is the reason this book was assembled.
This first section of the book was written in tribute to Charles David Keeling and his extraordinary contributions. The first chapter, written by Eric Sundquist and Ralph Keeling, son of Charles David Keeling, provides a historical account of his work, the Keeling Curve, and the challenges he faced to produce it.
Next, Peter Brewer of the Monterey Bay Aquarium Research Institute describes the importance of Keeling’s work on oceanic CO2 and how, more broadly, ocean CO2 research has changed in response to Keeling’s science. As Brewer suggests, Keeling “so influenced the careers of the small group of ocean CO2 scientists that have led the way that any one of them would write a similar account.”
Concluding this section, Steve Running with several coauthors, describes how the Keeling Curve provided a radically new understanding of the global carbon cycle. In Running’s own words, “. . . what was truly invaluable, a gift to humanity really, was that this data set gave us a 20- to 30-year advance warning that we should pay attention to human impact on the Earth System.”
![]()
The Mauna Loa Carbon Dioxide Record: Lessons for Long-Term Earth Observations
Eric T. Sundquist
U.S. Geological Survey, Woods Hole, Massachusetts, USA
Ralph F. Keeling
Scripps Institution of Oceanography, University of California, San Diego, La Jolla, California, USA
The Mauna Loa carbon dioxide record is an iconic symbol of the human capacity to alter the planet. Yet this record would not have been possible without the remarkable work of one man, Charles David Keeling. We describe three emergent themes that characterized his work: (1) his desire to study and understand the processes that control atmospheric CO2 and the global carbon cycle, (2) his campaign to identify and minimize systematic measurement error, and (3) his tenacious efforts to maintain continuous funding despite changing government priorities and institutions. In many ways, the story of the Mauna Loa record demonstrates that distinctions between research and “routine” measurements are not very useful in long-term monitoring of Earth properties and processes.
1. INTRODUCTION
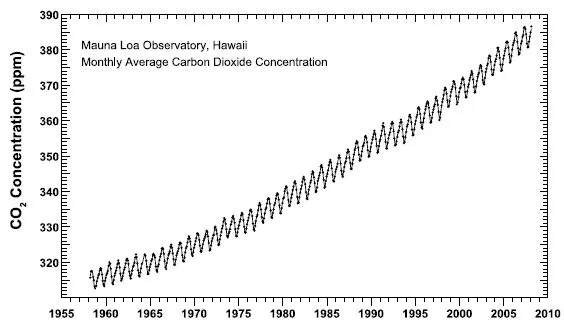
Charles David Keeling, who passed away in June 2005, directed a program to measure the concentrations of CO2 in the atmosphere that continued under his direction from the late 1950s until his passing in 2005. This program, operated out of Scripps Institution of Oceanography in collaboration with the National Oceanographic and Atmospheric Administration (NOAA), is responsible for the Mauna Loa CO2 record, which is almost certainly the best known icon illustrating the impact of humanity on the planet as a whole (Figure 1). Informally, this plot is known as the “Keeling Curve” throughout the scientific community.
This chapter emphasizes lessons learned about making long-term measurements based on the experiences of the Scripps atmospheric CO2 program. Readers are referred to C. D. Keeling’s autobiographical article, “Rewards and penalties of monitoring the Earth” [Keeling, 1998], which recounts many of the efforts, some quite exceptional, necessary to sustain the Scripps CO2 measurements at Mauna Loa and elsewhere for a period of decades. It is clear that a nearly unbroken record over such a long time frame would not have been possible without the singular talents and persistence of an extraordinary scientist, and it is doubtful that a single individual could accomplish similar lifetime achievements within the constraints of today’s science infrastructure. Nevertheless, we believe that the story of the Mauna Loa CO2 record offers fundamental lessons for current and future planning and implementation of long-term Earth observations. The need to monitor the Earth is now more acute than ever, and the development and implementation of useful long-term global observations is one of the major scientific challenges of our time.
This chapter draws on the authors’ familiarity with the published papers of C. D. Keeling (whom we will call CDK here) and on our experience as close observers of his work during the latter part of his professional career. We have also reviewed extensive documentation available in his files at Scripps. We focus here on three emergent themes.
1. The Scripps CO2 measurements were sustained above all by a multidecade research quest to understand the processes that control the long-term global mass balance and partitioning of carbon.
2. The quality and utility of the Mauna Loa CO2 data set and the other Scripps CO2 measurements depended on CDK’s career-long campaign to identify and minimize systematic error.
3. The Mauna Loa CO2 record and other Scripps CO2 measurements could not have been sustained without extraordinary efforts to maintain continuous funding despite the vagaries of government priorities and institutions.
Figure 1. Monthly average CO2 concentration at Mauna Loa Observatory, Hawaii, 1958–2005.
2. UNDERSTANDING THE CONTROLS ON ATMOSPHERIC CO2
The idea of making measurements at Mauna Loa arose while CDK was doing postdoctoral studies at Cal Tech. In the course of studying carbon in river water, a project that incidentally required making measurements of CO2 in air, he made the key discovery that when he sampled the air in places remote from cities and other obvious sources or sinks for CO2, he always got almost the same value of about 310 ppm [Keeling, 1958]. Previous measurements of CO2 in the atmosphere did not show such constancy, but those measurements had been made by wet chemical methods considerably less accurate than the dry manometric method he employed. This postdoctoral experience taught him two key lessons that were to guide his entire career: (1) the Earth system might behave with surprising regularity, and (2) highly accurate measurements are necessary to reveal this regularity.
The discovery of this stable background CO2 concentration begged the question of how stable was stable? Were there small fluctuations? Was the background rising because of human influences? Discussions ensued with Harry Wexler of the U.S. Weather Bureau, who suggested that CO2 concentrations be measured on a continuing basis at the newly created stations in Antarctica and near the summit of Mauna Loa. Rather than accepting an offer to join Wexler in Washington, D.C., CDK instead chose to move to the Scripps Institution of Oceanography, where Roger Revelle was interested in starting a CO2 measurements program. Revelle was independently interested in the question of rising CO2 and was working at the time on a landmark paper with Hans Suess on this topic. Revelle believed the right approach to resolving changes over time was to make large surveys of CO2 concentrations at many locations in the atmosphere and ocean at, say, decadal intervals. Wexler and Revelle both recognized that CDK’s methods and preliminary measurements held promise for obtaining a global “snapshot” of global CO2 levels during the International Geophysical Year of 1957–1958. By maintaining the interest and support of Wexler at the Weather Bureau, CDK was ultimately able to set up measurements at Antarctica and Mauna Loa while initiating an airborne and shipboard sampling program under Revelle at Scripps. Remarkably, by age 30, CDK had established the basic analytical techniques, sampling strategies, and calibration methods that would sustain his career-long contributions to understanding the nature and causes of variations in atmospheric CO2. This approach involved using a nondispersive infrared analyzer to compare samples from flasks or in situ measurements with calibration gases and employing a high-accuracy manometer for the absolute calibration of the calibration gases.
During the late 1950s, a growing number of scientists became interested in studying effects of human activities on the global carbon cycle—that is, the ongoing cyclic exchange of the element carbon in various forms among plants, animals, air, water, and earth [see Sundquist et al., this volume]. This interest was perhaps best exemplified by the Revelle and Suess manuscript. Published in 1957, that paper [Revelle and Suess, 1957, pp. 19–20] contained perhaps the most often quoted lines in the immense body of literature concerning human impacts on the global carbon cycle:
Thus human beings are now carrying out a large-scale geophysical experiment of a kind that could not have happened in the past nor be reproduced in the future. Within a few centuries we are returning to the atmosphere and oceans the concentrated organic carbon stored in sedimentary rocks over hundreds of millions of years. This experiment, if adequately documented, may yield a far-reaching insight into the processes determining weather and climate. It therefore becomes of prime importance to attempt to determine the way in which carbon dioxide is partitioned between the atmosphere, the oceans, the biosphere and the lithosphere.
For more than half a century now, the words “large-scale geophysical experiment” have been a rallying cry for the need to understand human manipulation of atmospheric CO2 as a profound global environmental change. In that single memorable paragraph, Revelle and Suess described the connections between human production of CO2 and the full array of earth and biological processes that cycle carbon, extending over geologic time. The statement’s reference to weather and climate is, of course, an allusion to the so-called greenhouse effect, a natural warming influence of the Earth’s atmosphere that is enhanced by increasing concentrations of CO2.
Against the background of this concern, the value of the Mauna Loa record quickly became apparent. The first year of measurements there was somewhat stressful, as measured CO2 concentrations drifted unexpectedly, in contrast to the relatively stable values observed in Antarctica. Understanding the drifting values was complicated by power outages that interrupted measurements for weeks at a time. Nevertheless, the mean values recorded at Mauna Loa agreed closely with those measured in Antarctica and in samples taken from ships and planes. Within just a few years, CDK showed that the observed variations at Mauna Loa were part of a regular seasonal cycle, reflecting the seasonal growth and decay of land plants in the Northern Hemisphere, superimposed on a steady long-term rise that was also observed in Antarctica and attributed to the burning of fossil fuels [Keeling, 1960; Pales and Keeling, 1965; Brown and Keeling, 1965]. In fact, the annual mean CO2 measurements at Mauna Loa turned out to be a very good representation of the global atmospheric average. These measurements provided not only the first global CO2 “snapshot” sought by Revelle but also the first opportunity to use systematic trends in atmospheric CO2 concentrations to understand the influence of global carbon cycle processes. In particular, the Antarctic and Mauna Loa records documented for the first time the year-to-year rise in global CO2 due to burning fossil fuels.
CDK realized from the start that understanding the Mauna Loa record required comparison to measurements at other widely distributed locations. By the mid-1960s, he had analyzed air samples collected from ships, planes, and land stations extending from Antarctica to Point Barrow, Alaska. During a year in Sweden, CDK worked with Bert Bolin (later to become the first Chair of the Intergovernmental Panel on Climate Change) to evaluate how the observed CO2 variations were affected by atmospheric circulation and by latitudinal and seasonal variations in industrial and natural uptake and release [Bolin and Keeling, 1963]. The long-term secular increase in atmospheric CO2 was determined to occur at about one-half the rate of industrial CO2 production [Pales and Keeling, 1965]. This crucial observation was quickly highlighted by the U.S. President’s Science Advisory Council, which extrapolated the effects of rising fossil fuel consumption to predict future atmospheric CO2 levels [Revelle et al., 1965]. Thus, within the first decade of his postgraduate career, CDK established the first global CO2 observation network, demonstrated that these observations are essential to discerning and anticipating trends in the natural and industrial processes that control atmospheric CO2, and provided the key data used to support research recommendations at the highest level in the U.S. government.
CDK also realized that his measurement methods could be extended to analysis of CO2 in gas samples equilibrated with ocean surface water. Knowing the importance of global air-sea CO2 exchange, and taking advantage of previous publications and the availability of the Scripps research fleet, he undertook the first global map of ocean surface dissolved CO2 concentrations [Keeling, 1968]. With Bolin, he developed numerical box models to simulate large-scale ocean-atmosphere exchange and mixing [Keeling and Bolin, 1967, 1968]. These efforts initiated CDK’s considerable influence on oceanic CO2 measurements, described in more detail by Brewer [this volume].
By the early 1970s, the Mauna Loa record had played a key role in launching international research programs to understand the effect of rising CO2 on climate [Keeling, 1998]. As the Scripps CO2 observations expanded to new sites and extended in time, the growing record continued to reveal the influence of global processes. The steady rate of increasing CO2 levels became a primary benchmark for refining models to predict the effects of burning fossil fuels on the global carbon cycle and climate. CDK was in the vanguard of this research. Not content with previous estimates of historical industrial CO2 production, he compiled and published his own estimates [Keeling, 1973], which stood as a standard data set for many years. With his Scripps colleagues Robert Bacastow and Charles Ekdahl, CDK used his CO2 measurements to constrain a predictive numerical box model of the global carbon cycle [Ekdahl and Keeling, 1973; Bacastow and Keeling, 1973]. This model was so well explained and meticulously documented that it became a carbon cycle “tutorial” for generations of younger scientists (including the authors of this chapter).
Continued measurements and modeling of the global CO2 budget in the 1970s and 1980s indicated that the cumulative fraction of industrial CO2 remaining in the atmosphere (the “airborne fraction”) was between 50% and 60% [Keeling et al., 1976b, 1985]. This observation was consistent with improved ocean models that showed that CO2 absorption by the oceans (perhaps combined with some uptake by terrestrial plants) could account for the rest of the industrial CO2 [Siegenthaler and Oeschger, 1978, 1987]. These conclusions were supported by measurements of the isotope ratio 13C/12C in samples of atmospheric CO2 collected by CDK in 1955–1956 and 1977–1978 [Keeling et al., 1979]. Thereafter, carbon isotope analyses were added to the suite of Scripps CO2 measurements in collaboration with Wim Mook of Groningen University.
As the atmospheric CO2 record exte...