![]()
CHAPTER 1
Why Pattern, Price, and Time?
Despite the proliferation of trading analysis programs claiming to have “new” indicators and “new” ways to analyze the markets, I’ve come to the conclusion that there really is not anything new under the sun and that all of these discoveries can be placed into the categories of pattern, price, and time.
Ever since the early days of trading up until today, traders have been trying to create ways to manipulate data in an effort to find an edge over everyone else. Today’s sophisticated programs have the ability to smooth data and create sophisticated formulas to make the market’s basic data appear to show anything the programs want to find. Some programs create moving averages, while others try to break down the markets into oscillators that move between 0 and 100. All of these new ways to look at data may be fine for some, provided that they understand how these numbers are created, and the programs create rules on how to use them, but I find working with the original Open, High, Low, and Close data to be most beneficial. In addition, while I acknowledge that using computer-generated oscillators or indicators may speed up the process of analyzing a market, I have found that all of these smoothing tools will eventually collapse to or agree with my simple analysis of the markets using the Open, High, Low, and Close.
This book, although it is concerned with the technical analysis approaches to trading Forex, futures, and equities, should not be considered the definitive answer to making tremendous amounts of money in trading. Instead it should be used as a guideline to give the trader an edge as to what is actually taking place in the marketplace. My application of pattern, price, and time analysis allows me to see and understand what is happening in the markets. It does not hide anything in complicated formulas or computer number crunching. Although this is a personal preference, I feel that the analyst who understands how pattern, price, and time work independently and in unison with each other creates an edge to trading the markets that computerized analysis cannot.
Throughout the book the reader will see the phrase “study and experiment.” This is because the reader is encouraged to learn as much as he can about the movements of the markets, the characteristics of these movements, and how to make informed trading decisions once this knowledge is applied.
The basic premise behind pattern, price, or time analysis is that these three factors have not changed in the 100 or more years since Charles Dow unleashed his Dow Theory to the world. In fact, if you want to go back even further, take a look at Candlestick analysis which is said to have its roots back to the 1700s. This very popular analysis tool is a study of pattern with basic Open, High, Low, and Close the major elements. Despite the proliferation of today’s “new” trading analysis tools and trading systems as a result of the personal computer and trading software, trading tools used today can nevertheless still be categorized as pattern, price, or time.
Today’s pattern studies include stochastic indicators, relative strength indicators, overbought/oversold indicators, moving average crossovers, and Candlesticks. Price is categorized as moving averages, daily pivots, and retracements. Finally, time is used today in the form of seasonality, cycles, and time of day studies.
Hang around a trading room long enough, and you will often hear, “I had the right price, but was a little early” or “I’ve got a cycle low due at 11:00, I just don’t know where the market will stop.” These are the types of problems that can be created by using only price, or only time, or only a pattern. In this book I want to show the trader that there is a way to bring the factors of pattern, price, and time together in an effort to improve trading results.
When studying the history of technical analysis I came across several valid methodologies to analyze and trade the markets, but I found that these methods were weighted toward only one of the three main components of pattern, price, and time. This created problems for me because although at times one of these factors had control of the market, I found I did not have control of the trade. This frustration caused me to study the disciplines of Elliott and Dow, but I found personal issues with each. One relied too much on the forecast and prevented me from changing my mind while in a trade. My ego became too connected to the forecast, and I often failed to make necessary adjustments to the trade. The other analysis technique took too long to develop. I also tried to work with point and figure charts, and although I understood how to use the formations, I still felt time was necessary to help me become a better trader. When Candlestick analysis became readily available on the computer, I tried to use it, but found some of the patterns occurred too frequently and at random places on the chart, so I sensed that price and time would be necessary to improve this sort of analysis.
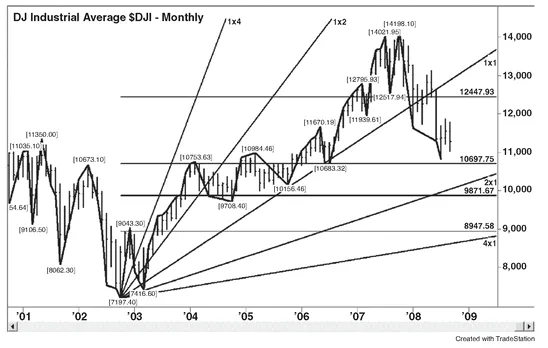
All of this study and experimentation of these other analysis disciplines led me back to the pattern, price, and time analysis of W. D. Gann. I chose Gann Theory as my primary source of analysis because throughout his works he wrote about the balance of price and time. This became very important to me because my work needed balance. I knew from my analysis and trading that I could not just rely on pattern, or price, or time independently. I knew that although I could use his techniques independently, I could improve my analysis and trading by finding a balance between his two or three key elements of pattern, price, and time (Figure 1.1).
FIGURE 1.1 Gann Format Monthly Dow Jones Chart Copyright © TradeStation.
In summary, the purpose of this book is to inform the trader of the analysis tools that are available just using the Open, High, Low, and Close. The other purpose is to teach the trader to categorize his trading tools into pattern, price, and time techniques and to apply combinations of the three to improve his analysis and trading. Finally, in an effort to jump-start the reader’s study and experimentation of pattern, price, and time, I have chosen to highlight the analysis and trading techniques of W. D. Gann because he was one of the first to speak of the balance of price and time.
![]()
CHAPTER 2
Who Was W. D. Gann?
If not the first technical market analyst, W. D. Gann was certainly among the more successful. Creating and publicizing a new approach to analyzing markets, Gann claimed that he had set a world’s record in leverage and accuracy more than once, that he had developed trading strategies for speculators, and that he could predict market moves to exact price levels.
William Delbert Gann was born on a cotton ranch on June 6, 1878, in Lufkin, Texas. He displayed a strong aptitude in mathematics during his early years, completed a high school education, and started trading in 1902 at the age of 24. By his own admission, Gann’s early trading was based on “hope, fear and greed,” all of which he later realized were not compatible with a successful trading strategy.
After losing significant sums of money, Gann began to observe that markets followed mathematical laws and certain time cycles. He was particularly interested in the connection between price and time, a relationship he referred to as the “square” of price and time. He began studying this interaction diligently, even traveling to England, India, and Egypt to research mathematical theory and historical prices.
In developing his theories, Gann was undoubtedly one of the most industrious technical analysts. He made thousands of charts displaying daily, weekly, monthly, and yearly prices for a wide variety of stocks and commodities. He was an avid researcher, occasionally charting a price back hundreds of years. At a time when most market analysis was strictly fundamental, Gann’s revolutionary theories relied on natural laws of mathematics, time cycles, and his unshakable conviction that past market activity predicted future activity.
Gann moved to New York City in 1908. He opened brokerage offices at 18 Broadway and began testing his theories and techniques in the market. Within a year it was clear to others that Gann’s success was based on more than just luck. A December 1909 article in The Ticker and Investment Digest explained that “. . . Mr. Gann has developed an entirely new idea as to the principles governing stock market movements” (reprinted in the W. D. Gann Commodities Course [Pomeroy, WA: Lambert-Gann Publishing, 178]).
In this article, Gann asserted that most traders enter the market without any knowledge or study, and that most eventually lose money. He explained that he noticed a cyclic recurrence in the rise and fall of stocks and commodities, and decided to study and apply natural laws to trading strategy. Gann indicated that months of studying at the British Museum in London revealed what he called the “Law of Vibration.” This law determines the exact points to which a stock would rise or fall, and predicts the effect well before the Street is aware of either the cause or the effect. Beyond this vague explanation, Gann was reticent about his strategies and unwilling to explain his theories in any detail.
Although past success is not an indication of future results, Gann’s trading was extremely successful, at least to a point. An analysis of his trading record over 25 market days revealed that Gann made 286 trades, 264 of which were profitable. His success rate of 92.31 percent turned an initial investment of $450 into $37,000. A colleague of Gann’s said, “I once saw him take $130.00 and in less than one month run it up to over $12,000.00. He can compound money faster than any man I ever met.” It is not surprising that the press concluded “. . . such performances as these. . . .are unparalleled in the history of the street” (Gann Course, 180). Although Gann’s theories were apparently profitable at times, he was equally subject to the potentially substantial risk of loss that is inherent in commodities futures trading.
Gann issued annual market predictions of major moves and exact support and resistance levels (
Figure 2.1). Newspapers around the country kept track of his predictions for 1921, 1922, and 1923, substantiating his accuracy. In January 1929, he issued an annual forecast that read:
September—One of the sharpest declines of the year is indicated. There will be a loss of confidence by investors and the public will try to get out after it is too late. . . . A “Black Friday” is indicated and a panicky decline in stocks with only small rallies.
Truth of the Stock Tape (reprint Pomeroy, WA: Lambert-Gann
Publishing, 1976, 36).
His facility in analysis and prediction extended to areas other than the market. He predicted the exact date of the Kaiser’s abdication, the end of World War I, and the elections of presidents Wilson and Harding. Gann also predicted the occurrence of World War II 13 years in advance and described the stealth bomber 61 years before its invention.
Gann’s original reticence about his success later turned into an almost religious fervor to share his knowledge. He had begun writing during his trading career, starting with Truth of the Stock Tape, written in 1923 (originally published by Financial Guardian Publishing Co.; reprinted by Lambert-Gann Publishing Co.). This book was intended to help traders analyze market activity using a standard stock tape. In 1927, he wrote The Tunnel Thru the Air: Or, Looking Back from 1940 (reprint Pomeroy, WA: Lambert-Gann Publishing Co., 1976). This seemingly autobiographical novel provides insight into Gann’s trading theories and his morals. (It also includes his predictions of World War II and the stealth bomber.) He went on to write books and courses explaining his new discoveries, including New Stock Trend Indicator, How to Make Profits in Commodities, and 45 Years in Wall Street (originally published in 1936, 1942, and 1949, respectively; all three books were later reprinted by Lambert-Gann Publishing Co., 1976). He also created home study courses for stocks and commodities and taught weekend seminars to explain the use of special price and time calculator tools he had invented. These materials were considered valuable enough that in 1...