Chapter 1: Getting Started
Introducing Data Analysis with Excel
This book is about using Microsoft Excel to analyze your data. Microsoft Excel is an electronic worksheet you can use to perform mathematical, financial, and statistical calculations; create charts; analyze your data with a PivotTable; maintain lists; and much more. Excel can help you locate data, find trends in your data, and present your data to others.
Each Excel file is a workbook. Each workbook can have multiple worksheets. Worksheets are made up of rows and columns of cells you can use to enter information.
The most powerful feature in Excel is its ability to calculate. When you enter a formula into Excel, Excel can automatically calculate the result, and when you make changes to your worksheet, Excel can automatically recalculate.
You can also use Excel to create charts. A chart is a graphical representation of your data. When using Excel, you can choose from several types of charts, including Column, Line, Pie, Bar, Area, and Scatter. Charts can make your data easier to read, easier to understand, and easier to compare.
A PivotTable is an interactive table you can use to analyze data. A PivotTable gives you an easy way to summarize and view large amounts of data. Using a PivotTable, you can rotate rows and columns of data so you can see different views of your data easily. You can use Excel to create PivotTables.
Excel provides a way for you to create and maintain lists. A list is a series of rows and columns. Each column has a label — for example, name, address, telephone number. Each row under a column has information pertaining to the column label. You can sort, filter, and analyze your lists in Excel.
Introducing Data Analysis with Excel
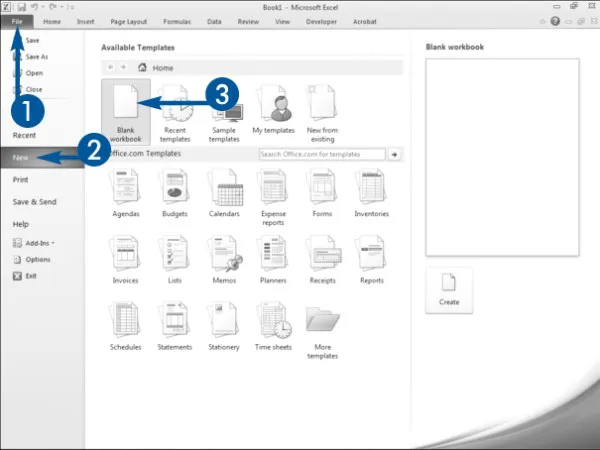
Open a New Workbook
A menu appears.
Double-click Blank workbook. • Excel opens a new workbook.
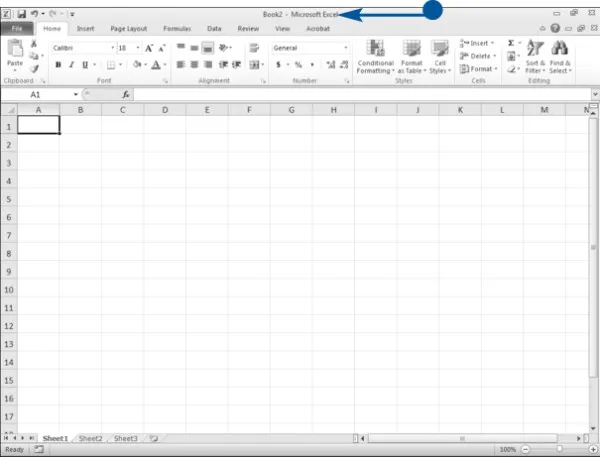
Tour the Excel Window
When you open an Excel workbook, Excel presents the Excel window. You use the window to create Excel documents. Your window should be similar to the one in the illustration. It may not be exactly the same because Excel renders windows based on the size of your screen, the resolution to which your screen is set, and the other screen display options.
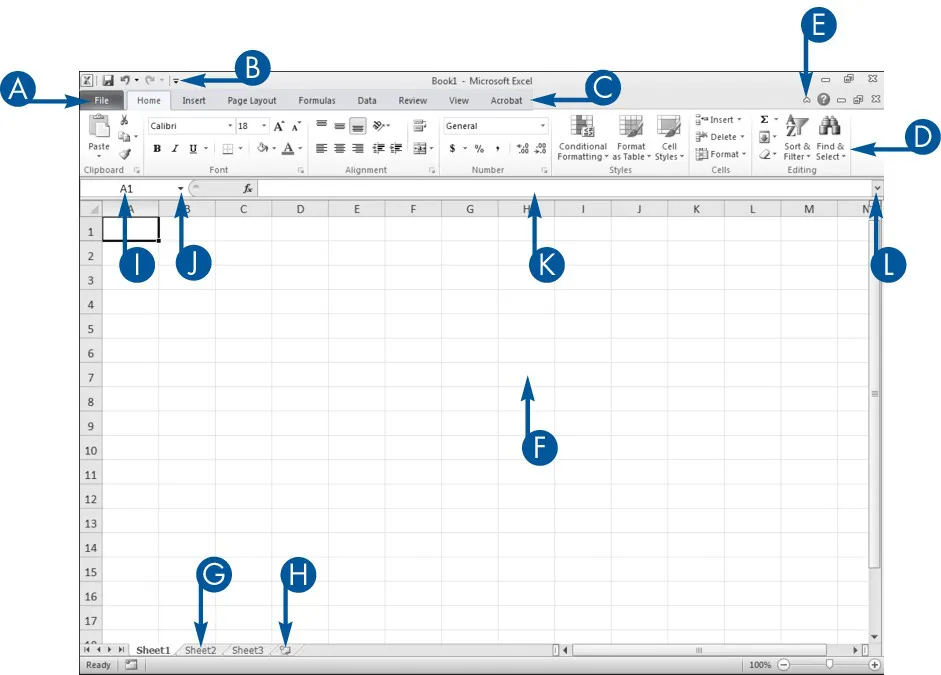
View of the Excel Window
Click the File tab to open, save, print, prepare, send, publish, and close files.
Place commands you use often on the Quick Access Toolbar.
Click a tab to view Ribbon options.
Click the buttons in the Ribbon to execute Excel commands.
Click the chevron to Hide the Ribbon so that only tabs show.
Enter data into cells.
Enter data into eac...