![]()
Section III
Statistical Analysis
![]()
Intensity-Duration-Frequency Curves
S. Rocky Durrans
Department of Civil, Construction, and Environmental Engineering, University of Alabama, Tuscaloosa, Alabama, USA
Intensity-duration-frequency (IDF) curves, or tables, are perhaps themost commonly used method for presentation of the characteristics of extreme rainfall events. This chapter provides an historical overview of developments in modeling and representation of IDF curves. Direction is provided to sources of information for IDF curve estimation, and alternative methods of modeling and representation of IDF relationships are discussed. Finally, this chapter provides an overview of contemporary IDF studies that are currently underway, as well as brief discussions of some emerging technologies that are leading to improvements in IDF curve estimation.
1. INTRODUCTION
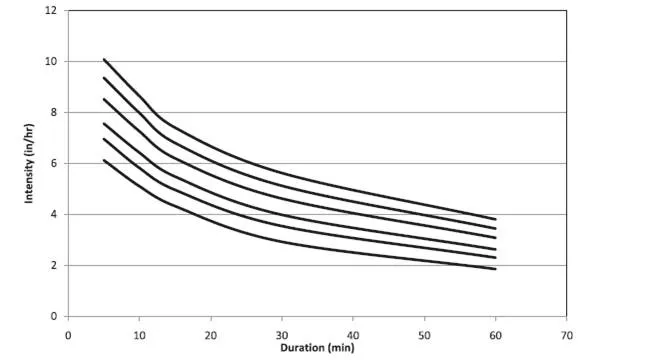
Intensity-duration-frequency (IDF) curves, or tables, are perhaps the most commonly used method for presentation of the characteristics of extreme rainfall events. (In the following the terminology IDF curves will be used repeatedly, though the text should be read to infer that this includes IDF tables or other methods of representation.) IDF curves, examples of which are illustrated in Figure 1, are usually constructed for a geographical site of interest with the storm duration (in units of time) on the horizontal axis and with the intensity (depth of precipitation per unit time) on the vertical axis. A family of curves is provided to depict the dependence of intensity on not only the duration of interest but also the frequency (return period or exceedance probability) at which that intensity has been observed at the site. The rainfall intensity indicated by a curve is the average intensity over the corresponding duration and does not reflect in any way the variations of intensity that may occur during that duration in an actual rainfall event. In any case, if any two of the intensity, duration, and frequency variables are known or given, the IDF curves may be applied to estimate the value of the third variable.
Intensity-duration-frequency curves are constructed to represent point rainfall characteristics and are strictly applicable only to the gauging site for which they have been assembled. They do not represent spatially averaged rainfall characteristics over sizable areas, nor are they applicable to geographical sites remote from the one for which they are constructed. The degree to which a set of IDF curves accurately represents spatial rainfall characteristics, or the rainfall characteristics at nearby sites, depends on local conditions.
This chapter provides an historical overview of the development and use of IDF curves. The presentation then turns to the pragmatic issues of how to construct a set of IDF curves for a particular locale using official publications and how they can be represented mathematically for use in computer software. Some methods and issues involved in development of IDF curves by subjecting raw rainfall data series to frequency analyses are also presented, but the reader is referred to El Adlouni and Ouarda [this volume] for more detailed information on this topic. This chapter closes with a brief description of some emerging methods and technologies for modeling and representing rainfall data.
2. HISTORICAL DEVELOPMENT
With the early efforts made in urban storm water management in the late 1800s and early 1900s, corresponding efforts began to be made in rainfall data collection and analysis. The primary motivation of these efforts was to study the relationship between rainfall intensity and duration. Burian et al. [1999] describe how A. N. Talbot, in 1899, plotted storm intensities for various durations on cross-section paper. Talbot then sketched two curves, one depicting very rare rainfalls and the other representing more ordinary rainfalls. While these were not IDF curves as we know them today, Talbot’s results were clearly a forerunner to present-day IDF curves.
Figure 1. Intensity-duration-frequency curves for Tuscaloosa, Alabama, based on data presented in HYDRO 35 [Frederick et al., 1977b].
2.1. Official National Weather Service Studies
In the United States, the earliest extensive study of rainfall extremes was undertaken by Yarnell [1935]. He constructed generalized rainfall maps for the coterminous United States for durations from 5 min to 24 h and for return periods from 2 to 100 years. His maps were based on data from about 200 firstorder Weather Bureau stations and were considered the basic source of information on rainfall extremes until the 1950s.
In the early 1950s, the Weather Bureau published Technical Paper 24 (TP 24) in two parts [Weather Bureau, 1953, 1954] using data from a network of U.S. Army Corps of Engineers gauges as well as Weather Bureau gauges. TP 24 was significant in its demonstration of the importance of the large amounts of data required to define short-duration rainfall characteristics in the mountainous regions of the western states.
Technical Paper 25 (TP 25) was published in 1955 [Weather Bureau, 1955]. That document contained IDF curves for durations from 5 min to 24 h and for return periods from 2 to 100 years for each of 203 locations in the United States, Alaska, Hawaii, and Puerto Rico. Those curves were developed by fitting the Gumbel (extreme value type 1) distribution to annual maxima, with no smoothing or regionalization of the relationships.
To support the needs of the Soil Conservation Service, Technical Paper 28 (TP 28) was published in 1956 [Weather Bureau, 1956]. That document presented rainfall characteristics for local drainage designs in the western United States (locations west of the 105th meridian) for durations from 20 min to 24 h and for return periods from 1 to 100 years.
Technical Paper 29 (TP 29) [Weather Bureau, 1957, 1958a, 1958b, 1959, 1960] was published in five parts to provide coverage of various portions of the United States east of the 90th meridian. This series of publications provided limited information on seasonal variations in rainfall characteristics and, for the first time, included areal reduction curves to permit point rainfall values represented by IDF curves to be converted to spatially averaged values. Publication of TP 29 appears to be the first time that seasonality in rainfall characteristics was explicitly considered.
In May1961, the Weather Bureau published Technical Paper 40 (TP 40) [Hershfield, 1961]. That document was “intended as a convenient summary of empirical relationships, working guides, and maps, useful in practical problems requiring rainfall frequency data” and covered the entire coterminous United States. TP 40 presents isohyetal maps and seasonal variation diagrams for rainfall durations from 30 min to 24 h and for return periods from 1 to 100 years. Since its publication, TP 40 has been considered a standard source of rainfall information for use by practicing engineers and hydrologists. An extension of TP 40 for durations from 2 to 10 days and for return periods from 2 to 100 years was published as Technical Paper 49 (TP 49) [Miller, 1964]. Additional extensions for short and long durations for Alaska were published as Technical Papers 47 and 52 [Miller, 1963, 1965].
By the middle to late 1970s, the growing awareness of environmental issues had increased the demand for hydrologic planning and design for small drainage areas having very short times of concentration. It was also recognized that for storm durations of less than 1 h, ratios of subhourly to hourly rainfall values that had been published in TP 40 were in need of revision as they had a discernible geographic pattern. These issues led to the publication of the NOAA Technical Memorandum NWS HYDRO-35 in June 1977 [Frederick et al., 1977b]. HYDRO-35, as it is commonly known, presents information on hourly and subhourly rainfall extremes for the eastern and central United States.
Because of the orographic effects caused by the high mountain ranges in the western United States, spatial variations in rainfall in that region are more complex than in other parts of the nation. Recognizing that TP 40 did not adequately address this issue, the National Weather Service (NWS) published the NOAA Atlas 2 [Miller et al., 1973] in11 volumes, with each volume being applicable to one of the western states. Extensions of that work for short durations (less than 1 h) were published for California [Frederick and Miller, 1979] and for the remaining western states [Arkell and Richards, 1986].
The National Weather Service is currently conducting rainfall frequency studies on a regional basis to update TP 40, HYDRO-35, and the NOAA Atlas 2 and is publishing the results of the new studies as theNOAAAtlas 14. The first four volumes of the NOAA Atlas 14 are complete as of this writing, and they cover the semiarid southwestern United States (including part of southern California) [Bonnin et al., 2004a], the Ohio River region [Bonnin et al., 2004b], Puerto Rico and the U.S. Virgin Islands [Bonnin et al., 2006], and the Hawaiian Islands [Perica et al., 2009]. Additional studies currently underway cover the balance of California, selected Pacific Islands, the southeastern and midwestern states, and Alaska.
All currently applicable studies that have been completed by the National Weather Service (or its predecessor, the Weather Bureau) can be obtained online using the Web site for the NWS’ Hydrometeorological Design Studies Center (HDSC), where the studies are organized by state (or U.S. territory) and duration.
2.2. Other Studies
Around 1990, growing concerns over the ages of TP 40, HYDRO-35, and the NOAA Atlas 2 provided motivation for a number of states and regions of the United States to fund studies to update those documents. In the roughly 20 years that had passed since those publications were developed, the lengths of historical rainfall records had increased significantly, and statistical methods for treatment of the data had also advanced.
Schaefer [1990] completed a study to support dam safety analyses in the State of Washington. A nearly identical study was completed in Montana [Parrett, 1997]. Other rainfall frequency studies were completed in the Midwest [Huff and Angel, 1992], northeast [Wilks and Cember, 1993; McKay and Wilks, 1995], Florida [Wanielista et al., 1996a, 1996b], Louisiana [Naghavi and Yu, 1995], Texas [Asquith, 1998], Oklahoma [Tortorelli et al., 1999], and Alabama [Durrans and Brown, 2001; Durrans and Kirby, 2004]. Unfortunately, this fragmentation of efforts resulted in different methods of raw data treatment, data analysis, and presentations of results from one study to another. Indeed, the most consistent thing that can be said about these state and regional studies is that they are inconsistent with one another.
Despite these consistency issues, these newer studies did yield some innovations in the ways in which frequency studies were presented. The Texas [Asquith, 1998] study, for example, presented contour maps of ...