The Manchester Physics Series General Editors: D. J. Sandiford; F. Mandl; A. C. Phillips Department of Physics and Astronomy, University of Manchester Properties of Matter B. H. Flowers and E. Mendoza Optics Second Edition F. G. Smith and J. H. Thomson Statistical Physics Second Edition F. Mandl Electromagnetism Second Edition I. S. Grant and W. R. Phillips Statistics R. J. Barlow Solid State Physics Second Edition J. R. Hook and H. E. Hall Quantum Mechanics F. Mandl Particle Physics Second Edition B. R. Martin and G. Shaw The Physics of Stars Second Edition A.C. Phillips Computing for Scientists R. J. Barlow and A. R. Barnett Written by a physicist, Statistics is tailored to the needs of physical scientists, containing and explaining all they need to know. It concentrates on parameter estimation, especially the methods of Least Squares and Maximum Likelihood, but other techniques, such as hypothesis testing, Bayesian statistics and non-parametric methods are also included. Intended for reasonably numerate scientists it contains all the basic formulae, their derivations and applications, together with some more advanced ones. Statistics features:
* Comprehensive coverage of the essential techniques physical scientists are likely to need.
* A wealth of examples, and problems with their answers.
* Flexible structure and organisation allows it to be used as a course text and a reference.
* A review of the basics, so that little prior knowledge is required.
eBook - ePub
Statistics
A Guide to the Use of Statistical Methods in the Physical Sciences
- English
- ePUB (mobile friendly)
- Available on iOS & Android
eBook - ePub
About this book
Trusted by 375,005 students
Access to over 1.5 million titles for a fair monthly price.
Study more efficiently using our study tools.
Information
‘It’s not the figures themselves,’, she said finally, ‘it’s what you do with them that matters’
—K.A.C. Manderville
CHAPTER 1
Using Statistics
Statistics is a tool. In experimental science you plan and carry out experiments, and then analyse and interpret the results. To do this you use statistical arguments and calculations. Like any other tool—an oscilloscope, for example, or a spectrometer, or even a humble spanner—you can use it delicately or clumsily, skilfully or ineptly. The more you know about it and understand how it works, the better you will be able to use it and the more useful it will be.
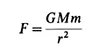
The fundamental laws of classical science do not deal with statistics or errors. Newton’s law of gravitation, for example, reads in pure and beautiful simplicity. The figure in the denominator is given as 2—exactly 2, not 2.000 ± 0.012 or anything messy like that. This can lead people to the idea that statistics has nothing to do with ‘real’ scientific knowledge.
But where do the laws come from? Newton’s justification came from the many detailed and accurate astronomical observations of Tycho Brahe and others. Likewise Ohm’s law

which appears so straightforward and elementary to us today, was based on Ohm’s many careful measurements with primitive apparatus. When you are studying science you may find no use for statistics—until you meet quantum mechanics, but that is another story—but as soon as you begin doing science, and want to know what measurements really mean, it becomes a matter of vital importance.
This is a textbook on statistics for the physical sciences. It treats the subject from the basic level up to a point where it can be usefully applied in analysing real experiments. It aims to cover most situations that are likely to be met with, and also provide a grasp of statistical ideas, terminology, and language, so that more advanced works can be consulted and understood should the need arise. It is thus intended to be usable both as a textbook for students taking a course in the subject, and also as a handbook and reference manual for research workers and others when they need statistical tools to extract their experimental results.
These two modes of use give rise to requirements in the ordering of the material which are not always happily reconcilable. For reference use one wants to group all material on a given topic together, but for teaching purposes this would be like learning a language from a dictionary. The solution adopted is that the unstarred sections cover the material roughly appropriate to a first year undergraduate course. They can sensibly be taken in order, with no anticipation of later material. The starred sections fill in the gaps; they may require knowledge of material in later sections, but when this occurs it is explicitly pointed out. Most of the basic material is in the early chapters, and Chapters 7, 9, and 10 contain entirely higher-level material. First-time-through readers should not be scared or put off by any apparent mathematical complexity they observe in some of the starred sections: these can (and should) be skipped over with a clean conscience, as they are not needed for later unstarred sections of the course.
‘Data! Data! Data!’, he cried impatiently.
‘I can’t make bricks without clay’.
‘I can’t make bricks without clay’.
—Sir Arthur Conan Doyle
CHAPTER 2
Describing the Data
It all starts with the data. You may call them a set of results, or a sample or the events, but whatever the name, they consist of a set of basic measurements from which you’re trying to extract some meaningful information.
To make your data mean something, particularly to an outside audience, you need to display them pictorially, or to extract one or two important numbers. There are many such numbers and ways of presenting the data in graphic form, and this chapter is devoted to methods of describing the data in a useful and meaningful way, without attempting any deeper analysis or inference. This is known as descriptive statistics.
2.1 TYPES OF DATA
Data† are called quantitative or numeric if they can be written down as numbers, and qualitative or non-numeric if they cannot. Qualitative data are rather hard to work with as they do not offer much scope for mathematical treatment, so most of the subject of statistics, and likewise most of this book, deals with quantitative, numerical measurements.
Quantitative measurements divide further into two types. Some, by their very nature, have to be integers and these are called discrete data. Others are not constrained in this way and their values are real numbers. These are called continuous data. Continuous data cannot be recorded exactly, as you cannot write down an infinite number of decimal places. Some sort of rounding and loss of precision has to occur.
For example, if you were to examine a sample of motor cars and record their colours, these would be qualitative data. The number of seats in each car has to be an integer, and would be discrete numeric data, as would the number of wheels. The lengths and the weights of the cars would be continuous numeric data.
Usually one of the first things to do in making sense of the data (which is just a pile of raw results) is to divide them into bins (also called groups or classes or blocks). For example, the results of tossing 20 coins, each of which comes down either heads (H) or tails (T)

can be written as {11H,9T}. This conveys the same information much more clearly and concisely.
For continuous numeric data it is not quite so simple, as your values are (almost certainly) all different, if you use enough decimal places. You have to group together adjacent numbers, using a range of values to define each bin. This means further rounding of values and throwing away precision information, which is the price you pay for rendering the data comprehensible. Usually the bins are chosen to be all the same uniform size, but in some cases it makes sense to use non-uniform bins of different sizes.
For discrete numeric data this grouping together of adjacent values is not compulsory, but it may be desirable when the numbers of data points with any particular value are small.
2.2 BAR CHARTS AND HISTOGRAMS
The numbers of events in the bins can be used to draw bar charts (see Figure 2.1) and histograms.
There is a technical difference between a bar chart and a histogram in that the number represented is proportional to the length of bar in the former and the area in the latter. This matters if non-uniform binning is used. Bar charts can be used for qualitative or quantit...
Table of contents
- Cover
- Contents
- The Manchester Physics Series
- Title Page
- Copyright
- Dedication
- Editors’ preface to the Manchester Physics Series
- Author’s Preface
- 1 USING STATISTICS
- 2 DESCRIBING THE DATA
- 3 THEORETICAL DISTRIBUTIONS
- 4 ERRORS
- 5 ESTIMATION
- 6 LEAST SQUARES
- 7 PROBABILITY AND CONFIDENCE
- 8 TAKING DECISIONS
- 9 RANKING METHODS
- 10 NOTES FOR NUMBER CRUNCHERS
- Bibliography
- Appendix 1 Answers to Problems
- Appendix 2 Proof of the Central Limit Theorem
- Index
- Notation
- Notation1
Frequently asked questions
Yes, you can cancel anytime from the Subscription tab in your account settings on the Perlego website. Your subscription will stay active until the end of your current billing period. Learn how to cancel your subscription
No, books cannot be downloaded as external files, such as PDFs, for use outside of Perlego. However, you can download books within the Perlego app for offline reading on mobile or tablet. Learn how to download books offline
We are an online textbook subscription service, where you can get access to an entire online library for less than the price of a single book per month. With over 1.5 million books across 990+ topics, we’ve got you covered! Learn about our mission
Look out for the read-aloud symbol on your next book to see if you can listen to it. The read-aloud tool reads text aloud for you, highlighting the text as it is being read. You can pause it, speed it up and slow it down. Learn more about Read Aloud
Yes! You can use the Perlego app on both iOS and Android devices to read anytime, anywhere — even offline. Perfect for commutes or when you’re on the go.
Please note we cannot support devices running on iOS 13 and Android 7 or earlier. Learn more about using the app
Please note we cannot support devices running on iOS 13 and Android 7 or earlier. Learn more about using the app
Yes, you can access Statistics by R. J. Barlow in PDF and/or ePUB format, as well as other popular books in Physical Sciences & Mathematical & Computational Physics. We have over 1.5 million books available in our catalogue for you to explore.