![]()
1
Gross Domestic Product
ECONOMICS HAS RECEIVED A BAD RAP. In the mid-nineteenth century, the great Scottish historian Thomas Carlyle dubbed this discipline “the dismal science,” and jokes about economists being more boring than accountants abound on Wall Street. But truth be told, there is nothing more exciting than watching the newswire on a trading floor of a money-center bank minutes ahead of the release of a major market-moving economic report. One of the top excitement generators is the report on gross domestic product (GDP)—an indicator that is a combination of economics and accounting.
Economists, policy makers, and politicians revere GDP above all other economic statistics because it is the broadest, most comprehensive barometer available of a country’s overall economic condition. GDP is the sum of the market values of all final goods and services produced in a country (that is, domestically) during a specific period using that country’s resources, regardless of the ownership of the resources. For example, all the automobiles made in the United States are included in GDP—even those manufactured in U.S. plants owned by Germany’s BMW and Japan’s Toyota. In contrast, gross national product (GNP) is the sum of the market values of all final goods and services produced by a country’s permanent residents and firms regardless of their location—that is, whether the production occurs domestically or abroad—during a given period. Baked goods produced in Canada by U.S. conglomerate Sara Lee Corporation, for example, are included in U.S. GNP, but not U.S. GDP.
GDP is a more relevant measure of U.S. economic conditions than GNP, because the resources that are utilized in the production process are predominantly domestic. There are strong parallels between the GDP data and other U.S. economic indicators, such as industrial production and the Conference Board’s index of coincident indicators (the coincident index), which will be explored in later chapters.
The GDP is calculated and reported on a quarterly basis as part of the national income and product accounts (NIPAs). The NIPAs, which were developed and are maintained today by the Commerce Department’s Bureau of Economic Analysis (BEA), are the most comprehensive data available regarding U.S. national output, production, and the distribution of income. Each GDP report contains data on the following:
• Personal income and consumption expenditures
• Corporate profits
• National income
• Inflation
These data tell the story of how the economy performed—whether it expanded or contracted—during a specific period, usually the preceding quarter. By looking at changes in the GDP’s components and subcomponents and comparing these with changes that have occurred in the past, economists can draw inferences about the direction the economy might take in the future.
Of all the tasks market economists perform, generating a forecast for overall economic performance as measured by the GDP data is the one to which they dedicate the most time. In fact, the latest report on GDP is within arm’s reach of most Wall Street economists. Because several departments in a trading institution rely on the economist’s forecasts, this indicator has emerged as the foundation for all research and trading activity and usually sets the tone of all of Wall Street’s financial prognostications.
EVOLUTION OF AN INDICATOR
Measuring a nation’s output and performance is known formally as national income accounting. This process was pioneered largely by Simon Kuznets, an economist hired by the U.S. Department of Commerce in the 1930s—with additional funding from the National Bureau of Economic Research—to create an accurate representation of how much the U.S. economy was producing. Up until that time, there was no government agency calculating this most critical of economic statistics.
The initial national income estimates produced by Kuznets in 1934 were representations of income produced, measures of the national economy’s net product, and the national income “paid out,” or the total compensation for the work performed in the production of net product. At that time, no in-depth breakdown of components existed. In fact, Kuznets didn’t even have a detailed representation of national consumption expenditures. This was the first step of several in the creation of a formal method of national income accounting, and yet was still a far cry from today’s highly detailed representation of the macroeconomy.
The result was the national income and product accounts. In addition to this immense task, Kuznets reconstructed the national income accounts of the United States back to 1869. (He was awarded a Nobel Prize in Economics in 1971 in part for this accomplishment.) Kuznets’s first research report, presented to Congress in 1937, covered national income and output from 1929 through 1935.
In 1947, the first formal presentation of the national income accounts appeared as a supplement to the July issue of the
Survey of Current Business. This supplement contained annual data from 1929 to 1946 disseminated in thirty-seven tables. These data were separated into six accounts:
1. National income and product account
2. Income and product account for the business sector
3. Government receipt/expenditure account
4. Foreign account
5. Personal income/expenditure account
6. Gross savings and investment account
Before the creation of the NIPAs, households, investors, government policy makers, corporations, and economists had little or no information about the complete macroeconomic picture. There were indexes regarding production of raw materials and commodities. There were statistics on prices and government spending. But a comprehensive representation of total economic activity wasn’t available. In fact, the term macroeconomy didn’t appear in print until 1939. Policy making without knowing the past performance of the economy, how it operated under different conditions and scenarios, or which sectors were weak and which were strong was a daunting task. This may have been the reason for many of the economic-policy failures of the early twentieth century.
Many economists have laid the blame for the Great Depression of the 1930s on the Federal Reserve Board’s failure to respond to the ebullient activity during the Roaring Twenties (sound familiar?). The Fed may bear much of the responsibility; but very few, if any, have defended the Federal Reserve’s failures on the grounds of insufficient information. The Great Depression forced the government to develop some sort of national accounting method. World War II furthered the government’s need to understand the nation’s capacity, the composition of its output, and the general economic state of affairs. How could the government possibly plan for war without an accurate appreciation of its resources? The NIPAs permit policy makers to formulate reasonable objectives such as higher economic growth rates or lower inflation rates, as well as to formulate policies to attain these objectives and steer the economy around any roadblocks that might impede the attainment of these goals.
DIGGING FOR THE DATA
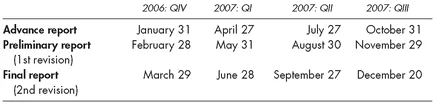
Tracking the developments in an economy as large and dynamic as that of the United States is not easy. But through constant revision and upgrading, a relatively small group of dedicated economists at the BEA accomplishes this huge task every quarter. Each quarterly report of economic activity goes through three versions, all available on the BEA website, www.bea.gov. The first, the advance report, comes one month after the end of the quarter covered, hitting the newswires at 8:30 a.m. (ET). So, the GDP report pertaining to the first three months of the year is released sometime during the last week of April, the second quarter’s advance report during the last week of July, the third quarter’s in October, and the fourth quarter’s during the last week of January of the following year. Because not all the data are available during this initial release, the BEA must estimate some series, particularly those involving inventories and foreign trade.
As new data become available, the BEA makes the necessary refinements, deriving a more accurate estimate for GDP. The second release, called the preliminary report, comes two months after the quarter covered—one month after the advance report—and reflects the refinements made to date. The last revision to the data is contained in the final report, which is released three months after the relevant quarter and a month after the preliminary report. The release dates for 2007 are shown in FIGURE 1.1.
Annual revisions are calculated during July of every year, based on data that become available to the BEA only on an annual basis, such as state and local government consumption expenditures. The BEA estimates these data on a quarterly basis via a judgmental trend based on annual surveys of state and local governments. Judgmental trends are quarterly interpolations of source data that are available only on an annual basis. Because the surveys are available on an annual basis, estimates can only be made during the annual revision.
Figure 1.1 2007 Release Schedule for GDP Reports
Source: U.S. Department of Commerce, Bureau of Economic Analysis
As source data for the components of the accounts are continuously updated and revised, the components of the NIPAs must be updated to reflect these revisions. That’s the primary function of the annual revision. Each of the three years’ (twelve quarters’) worth of data is subject to revision during this annual updating. Every five years the BEA issues a so-called benchmark revision of all of the data in the NIPAs. This has typically resulted in considerable changes to the five ye...