![]()
II
NEXT STEPS: TECHNOLOGY DETAILS
![]()
4
TECHNOLOGY SECTOR BREAKDOWN
Now you’ve got the basics of how the Technology sector works, and an understanding of its history and some of its drivers. But a high-level understanding is just the beginning. Just like our overall economy, each sector is made of many distinct parts—some relatively similar to others and some quite unique. To better understand the whole, you must understand the parts.
Chapter 1 covered the major Technology products and services: semiconductors, computer hardware, communications equipment, consumer electronics, software, and services. These offerings come from a variety of firms with very different end markets and drivers. While an understanding of every company isn’t necessary, a firm grasp on the major industries is vital before making any sector-related portfolio decisions. This chapter explores the sector’s industries and how an investor can begin forming opinions on each.
GLOBAL INDUSTRY CLASSIFICATION STANDARD (GICS)
Before beginning, some definitions: The Global Industry Classification Standard (GICS) is a widely accepted framework for classifying companies into groups based on similarities. The GICS structure consists of 10 sectors, 24 industry groups, 68 industries, and 154 sub-industries. This structure offers four levels of hierarchy, ranging from the most general sector to the most specialized sub-industry:
• Sector
• Industry Group
• Industry
• Sub-Industry
Let’s start by breaking down Technology into its different components. According to GICS, the Technology sector consists of 3 industry groups, 8 industries, and 16 sub-industries. Technology industries and corresponding sub-industries are:
Software
• Systems Software
• Application Software
• Home Entertainment Software
Computers & Peripherals
• Computer Hardware
• Computer Storage & Peripherals
Communications Equipment
• Communications Equipment
Semiconductors & Semiconductor Equipment
• Semiconductors
• Semiconductor Equipment
Electronic Equipment, Instruments & Components
• Electronic Components
• Electronic Equipment & Instruments
• Electronic Manufacturing Services
• Technology Distributors
IT Services
• Data Processing & Outsourced Services
• IT Consulting & Other Services
Internet Software & Services
• Internet Software & Services
Office Electronics
GLOBAL TECHNOLOGY BENCHMARKS
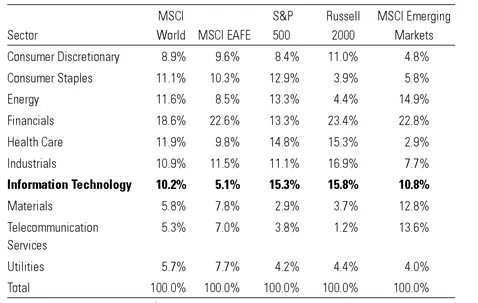
What’s a benchmark? What does it do, and why is it necessary? A benchmark is your guide for building a stock portfolio. You can use any well-constructed index as a benchmark—examples are in Table 4.1. By studying a benchmark’s (i.e., the index’s) makeup, investors can assign expected risk and return to make underweight and overweight decisions for each industry. This is just as true for a sector as it is for the broader stock market, and there are many potential Technology sector benchmarks to choose from. (Benchmarks will be further explored with the top-down method in Chapter 7.)
Differences in Benchmarks
So what does the Technology investment universe look like? It depends on the benchmark, so choose carefully! The US Technology sector looks very different from Europe, Japan, and the Emerging Markets. Table 4.1 shows major domestic and international benchmark indexes and the percentage weight of each sector.
Sector weights show each sector’s relative importance in driving overall index performance. While Technology is the smallest weight in the MSCI Europe, Australasia, Far East (EAFE) index, it’s the largest weight in the S&P 500. Why does Technology have more relative weight in the US? One potential reason could be the US has historically had a freer economic environment with the necessary capital to cultivate new ideas and innovation. It’s just tougher in many foreign developed nations to start a new business than it is in the US. This led to the establishment of Silicon Valley and produced many of the industry behemoths still in existence today.
Table 4.1 Benchmark Differences
Source: Thomson Reuters; MSCI, Inc.1 as of 12/31/08.
But sector and regional weights aren’t fixed and can change over time due to performance differences, additions and deletions of firms to the indexes, and a variety of other factors. For example, Financials, though still a sizeable sector, lost tremendous relative weight in most indexes through the 2008 bear market. Tech used to be much larger in most indexes prior to the 2000 to 2003 bear market. And for many decades, Industrials dominated. Sectors are constantly in flux.
Understanding how your benchmark and the sectors in it are structured is crucial to developing a portfolio because wide weight deviations can exist across regions and benchmarks. For example, in some countries, Technology is by far the largest sector; in others, it’s barely a few percent. Table 4.2 shows the Technology sector’s weight in selected countries. (In this example, the MSCI All Country World Index [ACWI] is used instead of the MSCI World to provide a wider scope.) Note: Tech in Finland more than triples the weight in the US. However, that weight is almost entirely concentrated in a single company: Nokia. Understanding how a sector is composed is vital—you don’t want to think you’re well diversified and find you’re holding just one stock!
Table 4.2 Technology Weights by Country
Source: Thomson Reuters; MSCI, Inc.2 as of 12/31/08.
| Country | Technology Weight |
|---|
| Finland | 54.3% |
| Korea | 23.3% |
| US | 15.5% |
| Sweden | 14.1 % |
| India | 13.9% |
| Japan | 12.3% |
| Germany | 4.8% |
| Netherlands | 4.0% |
| Canada | 3.5% |
| China | 2.9% |
| France | 2.6% |
| Hong Kong | 1.5% |
| Brazil | 1.3% |
| Spain | 0.6% |
| Australia | 0.6% |
| Switzerland | 0.4% |
| UK | 0.3% |
Industry Weights
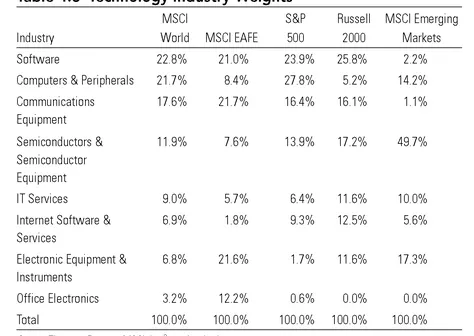
Not only can sector weights vary, but so can industry weights—sometimes greatly, depending on the chosen benchmark. Table 4.3 shows the weight of each Technology industry within each benchmark.
Table 4.3 Technology Industry Weights
Source: Thomson Reuters; MSCI, Inc.3 as of 12/31/08.
Understanding these weights allows you to not only properly weights your portfolio relative to your benchmark, but also effectively use your time by focusing on the most important components. For Technology, the largest industries are Software, Computers & Peripherals, Communication Equipments, and Semiconductor & Semicondictor Equipement-making up the majority of the weight in most benchmarks, and therefore the focus of much of this book.
A Concentrated Group
Another distinguishing Technology characteristic id the industries are concentrated in relatively few, very large players. Table 4.4 shows the percentage weight of the 10 largest firms in each industry (using the MSCI World). With concentrations ranging from 68 to 100 percent of the industry, the largest firms truly dominate.
Table 4.4 Concentration of Technology Industries
Source: Thomson Reuters; MSCI, Inc.4 as of 12/31/08. *Less than 10 companies in respective industry.
| Industry | Concentration of 10 Largest Firms |
|---|
| Communications Equipment | 99.2% |
| Computers & Peripherals | 95.0% |
| Electronic Equipment, Instruments & Components | 68.0% |
| Internet Software & Services | 100.0%* |
| IT Services | 73.5% |
| Office Electronics | 100.0%* |
| Semiconductors & Semiconductor Equipment | 76.2% |
| Software | 88.0% |
TECHNOLOGY INDUSTRY BREAKDOWN
Now that you know the general sector breakdown, we can examine Technology’s larger industries (based on their weight in the MSCI World Index) in greater detail. They break down into the following industries and sub-industries:
• Software
• Computers & Peripherals
• Communications Equipment
• Semiconductors & Semiconductor Equipment
Software
First, we’ll start with Software: The Software industry develops, markets, distributes, and supports virtually all forms of software. The industry is segmented further into three sub-industries:
• Systems Software
• Application Software
• Home Entertainment Software
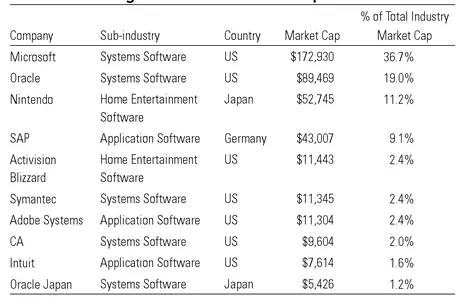
Table 4.5 lists the 10 largest Software firms globally. It’s easy to see the heavy concentration in the US.
Table 4.5 10 Largest Global Software Companies
Source: Thomson Reuters; MSCI, Inc.5 as of 12/31/08.
Systems Software Systems Software is the largest of the group. Firms in this sub-industry construct programs that run and help manage hardware. Since almost all forms of hardware require software to function, products in this market are less discretionary in nature. Here, you’ll find operating systems, middleware, virtualization (explained further in Chapter 6), and security software. Industry giants Microsoft and Oracle sit at the top of this market.
Application Software Application Software is a very diverse sub-industry. Firms in this sub-industry design software to perform specific “applications,” or tasks. The possibilities are near limitless and depend only on the ability to imagine new tasks to perform. As such, firms included in this sub-industry produce software for human resources, graphic design, customer relationship management (CRM), and tax planning, to name a very few.
SAP and Adobe Systems are the largest pure Software players in this group. But many software firms compete in multiple markets and don’t fall into the Application Software sub-industry—Oracle is a prime example. While it’s classified as Systems Software, it happens to be SAP’s largest and most formidable competitor in application software. Certain programs from Microsoft also compete in this category, like its Office Suite. Put another way, the application software market is much larger than the MSCI World Index sub-industry suggests.
A Hungry Giant
Competing with SAP was no small task for Oracle. Since Oracle’s purchase of PeopleSoft in 2005, the firm has completed or engaged in over 50 acquisitions. This impressive string of purchases expanded Oracle’s application software portfolio and improved competitiveness with its German rival. This also created extensive cross-selling opportunities, which the firm has used to maintain growth.
Home Entertainment Software The Home Entertainment Software sub-industry is much smaller than its peers. This is true of both size (aggregate market capitalization) and the number of firms. It’s also less diverse because of its focus on a single area: video...