This fourth, updated edition contains the latest developments in analytical techniques. An international team of authors summarizes the information on biological influences, analytical interferences and on the variables affecting the collection, transport and storage, as well as preparation of samples. In so doing, they cover age, gender, race, pregnancy, diet, exercise and altitude, plus the effects of stimulants and drugs. National and international standards are described for sampling procedures, transport, sample identification and all safety aspects, while quality assurance procedures are shown for total laboratory management.
In addition, this practical book contains a glossary of key terms for quick reference.
For everyone involved in patient care and using or performing laboratory tests.
eBook - ePub
Diagnostic Samples: From the Patient to the Laboratory
The Impact of Preanalytical Variables on the Quality of Laboratory Results
- English
- ePUB (mobile friendly)
- Available on iOS & Android
eBook - ePub
Diagnostic Samples: From the Patient to the Laboratory
The Impact of Preanalytical Variables on the Quality of Laboratory Results
About this book
Trusted by 375,005 students
Access to over 1.5 million titles for a fair monthly price.
Study more efficiently using our study tools.
Information
1
Dream and reality
The importance of the preanalytical phase
A new patient with diabetes mellitus is encountered
Mrs Haseltine is a 56-year-old lady who lives in a remote area. She consults her nearby practitioner and reports that over the last 2 weeks she has urinated more frequently than usual. Also, her body weight has decreased, although she “drinks more soft drinks than ever before”. The practitioner finds a positive dipstick result for glucose in her urine. Using a glucometer, he measures glucose from fingertip blood obtained by pricking with a fine lancet. The first drop of blood is washed away with a swab of gauze. In the following drop, glucose is measured by the meter, a process that takes about 30 seconds. The result is 280 mg/dL (15.56 mmol/L), far above the upper limit of the normal range. Mrs Haseltine is informed that she may have diabetes mellitus and is referred to a diabetologist the next day
The right sample for the right test at the right time
The diabetologist confirms the result obtained by the practitioner using a capillary blood sample taken 1 hour after breakfast.
Fig. 1-1
Two blood samples are drawn from the patient the following morning (after she has fasted for 12 hours), from the antecubital vein into closed tubes, one, with a lavender-coloured stopper, containing EDTA, the other, with a green cap, containing heparin. Mrs Haseltine is informed that she has type II diabetes mellitus. She is asked to phone the next day to obtain information on her laboratory results and for further advice.
In the meantime, the heparin blood sample has been centrifuged to separate plasma from the cellular elements. Both tubes are sent to the laboratory by courier in a container especially designed to keep samples at constant temperature. The laboratory receives the samples together with the patient’s data and requests for determinations: glycated haemoglobin and blood cell counts from the EDTA blood; potassium and creatinine from the plasma, which has been separated from blood cells, in the closed heparin tube.
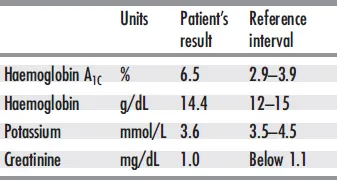
The laboratory technician identifies all the samples by comparing the name and bar code number with those on the request sheet. He then enters the request into the lab computer. The samples are put into bar code-reading analyzers for identification and performance of the requested tests. A subsample is taken from the EDTA blood – after slowly mixing it for 3 minutes on a roller mixer – for the determination of haemoglobin A1c by chromatography. The laboratory report, shown in Tab. 1-1, is sent to the diabetologist the next morning.
Mrs Haseltine is taken into the neighbouring county hospital together with a letter from the diabetologist informing the clinician about all tests performed and the results obtained. After 2 weeks of treatment, Mrs Haseltine has learned to control her blood sugar using a small glucometer. No further treatment is needed for the next few years.
Tab. 1-1 Laboratory report Haseltine, Elsa – July 13, 2008, 10 a.m.
This is what might happen in reality
Mrs Haseltine goes to the practitioner with the same symptoms for the same condition. In contrast to the positive urine dipstick result for glucose, the blood sugar is nearly normal (120 mg/dL). The practitioner, to play it safe, again refers the patient to a diabetologist.
One week later, Mrs Haseltine is called in for a glucose tolerance test. The only advice she is given is to fast the night before the test. Mrs Haseltine wakes up late, however, and misses her morning appointment. She arrives at the doctor’s office at noon, having had a snack on the way. She is stressed when the nurse offers her a glucose-containing drink after taking a “fasting” blood specimen.
She feels nauseated while slowly consuming the drink. Whilst waiting for the nurse, she decides not to drink it all and empties the remaining drink down the bathroom sink. Of course, she doesn't report this incident to the nurse when she returns to take a capillary blood sample at 1 and 2 hours after the first sample.
When the results are shown to the doctor (Tab. 1-2), he realizes that the glucose concentrations after the first and second hour are not that much different. The diabetologist, unable to arrive at a diagnosis, asks the patient to report the following day at which time two venous blood samples are collected, one with a lavender-coloured stopper and the other with a green cap. The tubes are sent to a private laboratory by car. Next day, the results shown in Tab. 1-3 are received by E-mail together with the reference values for each test. The glucose value is now normal, potassium elevated and haemoglobin A1c, an indicator of mean blood glucose, elevated to diabetic levels. The diabetologist, concerned by the high potassium level, refers the patient to a clinic. This institution diagnoses that the patient has type II diabetes mellitus, based on their laboratory results.
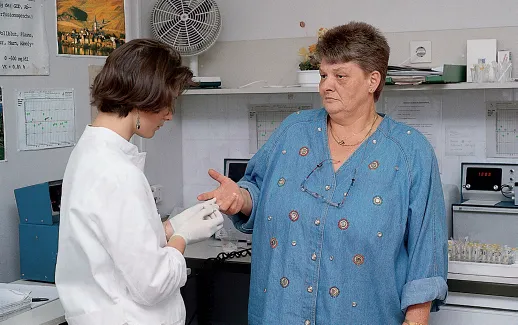
Fig. 1-2

Tab. 1-2 Results in doctor’s office: glucose tolerance test Haseltine, Elsa – July 12, 2008, 2 p.m.
| Fasting | glucose 160 mg/dL |
| 1-Hour | glucose 110 mg/dL |
| 2-Hour | glucose 120 mg/dL |
Tab. 1-3 Report from private laboratory Haseltine, Elsa – July 13,2008, 3 p.m.
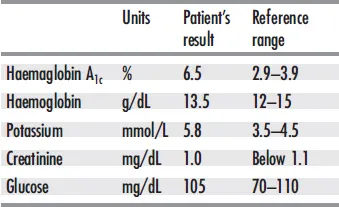
Fig. 1-3

What happened to Mrs Haseltine’s samples?
Undoubtedly, Mrs. Haseltine was in a diabetic state. Why was the fasting blood sugar nearly normal?
Answer: Fasting may result in nearnormal values in type II diabetics. In this case, the nurse took the first drop of blood from a fingerprick after “milking” the finger to obtain sufficient blood.
Why was the result of the glucose tolerance test inconclusive?
Answer: The first result was related to patient stress, which leads to increased amounts of glucose being released from liver glycogen stores. Moreover, Mrs Haseltine had a snack on her way to the doctor because she was hungry.
She did not report this to the doctor or the nurse, because she wasn't aware of the possible influence of this snack. For the same reason, she did not report not consuming all of the glucose drink, which had led to a decrease rather than an increase of blood glucose after 1 hour. The “increase” at the second hour may have been due either to method variation or to a reactive increase brought about by metabolic reactions in the late afternoon. Normally, a glucose tolerance test is performed in the morning, the reference values being valid only for the morning. It should be carried out under standard conditions, as recommended by national and international expert panels.
Why was potassium elevated and glucose normal in the venous specimen?
Answer: The sample was transported in contact with the cells for over 2 hours in a non-air-conditioned car on a hot day. This caused the blood cells to metabolize glucose and release potassium, the concentration of which is approximately 40 times higher in cells than in plasma. This in vitro influence makes unstabilized blood unsuitable for glucose determination. Potassium can be reliably measured only if plasma is promptly separated from the cells.
All these errors could have been prevented had the preanalytical phase been strictly controlled. Mrs Haseltine would have been diagnosed earlier with less stress and fewer costs would have been incurred.
This book is intended to increase awareness of the importance of all steps of the preanalytical phase, including patient preparation, sampling, transport and storage of patient samples.
In each chapter, possible preanalytical variables are explained with regard to mechanisms, effects and preventive actions intended to prevent misinterpretation of laboratory results. In the respective chapters, warnings are given in red and recommendations in green. Like disease mechanisms, biological influences can change the concentration of measured analytes in vivo, whereas in vitro changes have to be separated into changes undergone by the measured analyte and interference of the method used to measure the analyte. These definitions are important, because only the latter can be avoided by using a more specific method. The interested reader is referred to the References (p. 90) as well as the Glossary which defines all the special terms used in this book (p. 102). Detailed information on preanalytical variables of all analytes together with the recommendations on the choice of anticoagulant, the optimal sample volume and the stability of analytes in sample matrix is referred to the website www.diagnosticsample.com (112). It is to be hoped that the new edition helps to improve sample quality and decrease preanalytical errors (25, 171).
Optimal treatment of the patient and their samples is defined as the gold standard

2
Something unavoidable
Influences of age, gender, race and pregnancy
Intrinsic influences such as race, gender and age may influence target analyte concentrations in clinical chemistry and haematology. These variables are individual features of a subject and hence not subject to change. Quite often, intrinsic and external factors are difficult to distinguish.
Age
Age may affect blood and urine analyte concentrations after birth, during adolescence or in old age (Fig. 2-1). Erythrocyte counts and hence haemoglobin are much higher in neonates compared to adults. Within the first few days following birth, increased arterial oxygen provokes erythrocyte degradation. The resulting increase in haemoglobin leads in turn to enhanced concentrations of bilirubin. Since liver function (here in particular glucuronidation) is not fully established in neonates, increased concentrations of bilirubin are observed.
Fig. 2-1 Age dependence of various substrates and enzyme activity (9, 49). AP was measured at 30 °C (86°F)
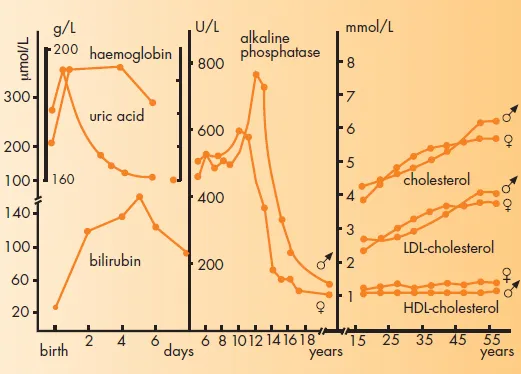
Uric acid concentrations in neonates are in a range similar to adults. However, within days after birth, a significant decrease is observed. Other examples of agedependence include alkaline phosphatase activity (AP) in serum (which peaks during the growth phase, mirroring bone osteoblast activity) and total and low-density lipoprotein (LDL)-cholesterol. In addition, agedependent AP activity and LDL- and high-density lipoproteine (HDL)-cholesterol in serum are influenced by gender. These gender differences in turn change as a function of age.
Race
Fig. 2-2 illustrates examples of analytes which are affected by race. Black Americans of both genders have significantly lower white blood cell counts compared to whites. This difference is readily explained by a reduction in the number of granulocytes. In contrast, haemoglobin, haematocrit and lymphocyte counts are almost identical in both groups (148). The monocyte count in whites exceeds that of blacks (13). A significant difference in creatine kinase (CK) activity has been observed for both genders in black and white people. This difference is not due to differences in age, height or body weight (123). The distribution of creatinine is similar to CK. Both quantities are partly determined by the muscle mass. The gender and race differences are more pronounced with increasing age and exist also for the relationship of serum creatinine to glomerular filtration rate (271). Using the same reference range for serum creatinine without consideration of age, gender and race/ethnicity for glomerular filtration rate screening can be misleading. Significant racial differences have been reported for serum concentrations of vit...
Table of contents
- Cover Page
- Contents
- Title
- Copyright
- Preface and Acknowledgements
- Foreword to the First Edition
- 1 Dream and reality
- 2 Something unavoidable
- 3 Changing habits
- 4 May I take coffee, smoke or drink before blood sampling?
- 5 What if I take herbs?
- 6 When to test?
- 7 Sampling during infusion therapy?
- 8 Sampling in the supine or upright position?
- 9 What site for sampling blood?
- 10 Blood from the skin
- 11 Did the lab mix up my sample?
- 12 A precious sample
- 13 A sample that is nearly always available
- 14 Plasma or serum?
- 15 Take a lavender tube!
- 16 Fax me a sample
- 17 Samples in transit
- 18 How to keep a sample „fresh“
- 19 What has to be done on specimen arrival?
- 20 Continuous or batchwise?
- 21 Safety aspects during the preanalytical phase
- 22 What is needed before blood transfusion?
- 23 Why a separate tube for the coagulation test?
- 24 Blood cells are sensitive!
- 25 Everything from a drop of blood?
- 26 Special tubes for hormones and proteomics?
- 27 Blood cells can provide important information
- 28 How to handle genes
- 29 When gases evaporate
- 30 The right time for drugs …
- 31 Bacteria, fungi, parasites and viruses
- 32 Can turbid samples be used?
- 33 A difficult case
- 34 The serum sample looks reddish
- 35 Does the laboratory have to know all my drugs?
- 36 Everything under control?
- References
- Glossary
- Index
Frequently asked questions
Yes, you can cancel anytime from the Subscription tab in your account settings on the Perlego website. Your subscription will stay active until the end of your current billing period. Learn how to cancel your subscription
No, books cannot be downloaded as external files, such as PDFs, for use outside of Perlego. However, you can download books within the Perlego app for offline reading on mobile or tablet. Learn how to download books offline
Perlego offers two plans: Essential and Complete
- Essential is ideal for learners and professionals who enjoy exploring a wide range of subjects. Access the Essential Library with 800,000+ trusted titles and best-sellers across business, personal growth, and the humanities. Includes unlimited reading time and Standard Read Aloud voice.
- Complete: Perfect for advanced learners and researchers needing full, unrestricted access. Unlock 1.5M+ books across hundreds of subjects, including academic and specialized titles. The Complete Plan also includes advanced features like Premium Read Aloud and Research Assistant.
We are an online textbook subscription service, where you can get access to an entire online library for less than the price of a single book per month. With over 1.5 million books across 990+ topics, we’ve got you covered! Learn about our mission
Look out for the read-aloud symbol on your next book to see if you can listen to it. The read-aloud tool reads text aloud for you, highlighting the text as it is being read. You can pause it, speed it up and slow it down. Learn more about Read Aloud
Yes! You can use the Perlego app on both iOS and Android devices to read anytime, anywhere — even offline. Perfect for commutes or when you’re on the go.
Please note we cannot support devices running on iOS 13 and Android 7 or earlier. Learn more about using the app
Please note we cannot support devices running on iOS 13 and Android 7 or earlier. Learn more about using the app
Yes, you can access Diagnostic Samples: From the Patient to the Laboratory by Walter G. Guder,Sheshadri Narayanan,Hermann Wisser,Bernd Zawta in PDF and/or ePUB format, as well as other popular books in Medicine & Biostatistics. We have over 1.5 million books available in our catalogue for you to explore.