![]()
Part One
Introduction
![]()
Chapter 1
Basic Concepts and Terms
Chromatography is a technique of separation of compounds – components of a mixture. Chromatography can be analytical [1], or – as in the case of preparative chromatography [2–4] – it can be other than analytical. The purpose of analytical chromatography is to obtain information regarding a mixture and its components rather than to make a product. Here the analytical chromatography has been considered only. How clean is the air in this room? What are the major components of the gasoline in this container? Is this pesticide present in the soil at this location, and, if yes, how much of it is there? To answer these and similar questions, one can analyze a representative sample of a mixture in question – a test mixture.
A chromatograph or a chromatographic instrument consists of several devices. The key device is the separation device – the one where the separation takes place. In column chromatography, the separation device is a chromatographic column – a tube that either has a special material along its inner walls (an open tubular column) or is packed with small particles (packed column) or with a porous material. The separation occurs due to different levels of nondestructive interactions of different components (analytes, species) of a test mixture with the material inside the column. As the subject of this book is the column analytical chromatography, from now on, the term chromatography will always infer that technique.
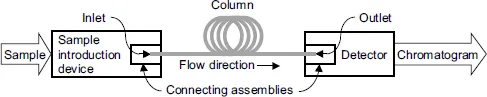
In addition to a column, a typical chromatograph includes, Figure 1.1, a sample introduction device [5–10] and a detector [5,6,10,11]. A chromatograph also requires a fluid (eluent [6, 12], mobile phase) that flows through the column from its inlet to the outlet transporting components of a test mixture in the same direction. In gas chromatography (GC), the mobile phase is an inert carrier gas, in liquid chromatography (LC), the mobile phase is a liquid. To emphasize the fact that the components of a test mixture are soluble in the mobile phase, they are also called the solutes.
A set of conditions for the execution of a chromatographic analysis (a run) – the column type and temperature, the carrier gas type and its flow rate or pressure, the sample introduction device and the detector together with their operational conditions, and so forth – comprise a method of the analysis.
A chromatographic analysis starts with a quick (ideally, instantaneous) injection of a test mixture into the column inlet. While being transported through the column, different solutes differently interacting with the column interior migrate through the column with different velocities. As a result, each solute is retained (resides) in the column for different amount of time, known as the retention time or the residence time. Different retention times cause the solutes to elute – to pass through the column outlet – separately from each other constituting the separation of the solutes.
When an eluite [6, 13] (a solute eluting from a column) mixed with effluent [12] (mobile phase leaving a column) passes through a detector, the latter generates a response indicative of the presence of the solute in the detector. Ideally, a detector response to each solute should be proportional to the solute amount or concentration.
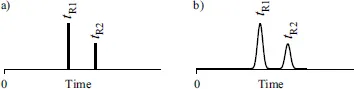
A way to observe the separation result is through a chromatogram representing a plot of a detector signal – the detector response as a function of time elapsed since the injection of a test mixture. A simple chromatogram resulted from analysis of a two-component mixture is shown in Figure 1.2. Ideally, it should be a line chromatogram [14–16] shown in Figure 1.2a. Unfortunately, no matter how quick was the injection, each solute migrating along the column occupies a zone (a band) whose width gradually increases with time. As a result, each eluite and a corresponding peak have nonzero width as shown in Figure 1.2b.
Usually, a chromatographic analysis does not end with the generation of a chromatogram. A contemporary chromatographic system might include a chromatograph and a data analysis subsystem. The latter might quantify and identify the peaks and report retention time, width, area, height, amount, concentration, and other information regarding each peak.
Two different concepts – a solute zone and a peak – have already been mentioned in the preceding text. A zone, Figure 1.3, is a space occupied by a solute migrating in a column. The distribution of a solute zone along a column can be described (Figure 1.3b) by the solute’s specific amount, a(z), – the solute amount (mass, mole, and so forth) per unit of length. The width of a zone is measured in units of length along the column. A peak, on the other hand, can be a zone elution rate [06], a detector signal in response to elution of the zone, or a portion of chromatogram (Figure 1.2b) representing that signal. In either case, the width of a peak is measured in units of time. The distinction between the terms a zone and a peak is recognized throughout the book. Typically, both a zone and a peak representing the zone have similar pulse-like shape with a clearly identifiable maximum.