- Evaluates the natural history of congenital heart lesions as a background to finding out if and how much treatment has improved outcomes
- Introduces and defines lesions, providing general information about its frequency, familial or syndromic associations, and associated congenital heart lesions
- Provides sections on pathological anatomy and physiology – important in determining outcomes
- Includes results of surgery, both in terms of survival and also in terms of event-free survival, that is, survival free of reoperation, cardiac failure, arrhythmias, and other late complications that are often seen
- Helps cardiologists and cardiac surgeons understand what is likely to happen to patients with or without treatment, and which forms of treatment currently in use provide the best outcomes to date

- English
- ePUB (mobile friendly)
- Available on iOS & Android
eBook - ePub
The Natural and Unnatural History of Congenital Heart Disease
About this book
Trusted by 375,005 students
Access to over 1.5 million titles for a fair monthly price.
Study more efficiently using our study tools.
Information
1
Introduction
1
Practical and Theoretical Considerations
Considerations: natural history
Knowing the natural history of any disease, that is, what happens to people with that disease without treatment, is a prerequisite for knowing whether, when, and how to treat it. For many diseases, the natural history is well known, but this is not true for congenital heart disease.
To appreciate the problems, imagine designing a study of the natural history of a congenital heart lesion. One way would be to diagnose within a given year with certainty every child with that particular congenital heart disease immediately after birth. The diagnosis includes the basic lesion, any relevant subtypes, and an estimate of severity. Then each subject in the cohort is followed without treatment until death (longitudinal or cohort study).
Now consider the barriers to such a study. In the USA there are about 40,000 children born each year with some form of congenital heart disease. When broken down into subtypes, however, the numbers with any subtype may be small enough that births will need to be monitored for several years to provide consistent data. Second, the duration of follow-up might have to be very long. For example, the oldest recorded patient with an atrial septal defect lived to be 96 years old. Finally, accurate diagnosis by cardiac catheterization became available only in the 1950s, and even later for infants. By that time, surgical treatment of major forms of congenital heart disease was available, so that it was impossible to follow for life untreated patients who had been diagnosed with certainty. In addition, many forms of congenital heart disease that cause early death may not be diagnosed without an autopsy examination [1,2] and autopsies are not always done. Apart from these problems, patients followed for many years without cardiac surgery cannot be regarded as having no changes in nonsurgical care during their lifetime. The longitudinal method implies that the outcomes would be same for patients born in any year, a process known as stationarity, and this is unlikely to be true because of nonspecific changes in medical therapy. Improved treatment of congestive heart failure, infective endocarditis, and pneumonia has altered the natural history. Nevertheless, improved survival from these medical treatments was probably modest. Digitalis and diuretics were used early in the 20th century, but prolonged life by no more than a few years. The only change that made a difference was antibiotic treatment for pneumonia, infective endocarditis, and tuberculosis, all of which previously accounted for many deaths in these patients. From that time until the extensive application of surgery to this population, there were no substantial improvements in medical treatment. Therefore some degree of stationarity exists, and differences from early in the 20th century up to the advent of cardiac surgery probably had little effect on the natural history of congenital heart lesions.
Longitudinal and cross-sectional analysis
These problems do not mean the natural history of congenital heart disease was not studied before the 1950s. Clinical diagnoses of patent ductus arteriosus, ventricular septal defect, pulmonic and aortic stenosis, coarctation of the aorta, and tetralogy of Fallot were made, although seldom in neonates. However, modifiers such as size of shunt or pressure gradients were often not available. There is one significant exception to these criticisms. In Bohemia (at that time in Czechoslovakia), there was excellent diagnostic cardiology but virtually no cardiac surgery until recently. Samánek et al. [3,4] took the opportunity to obtain the natural history of well-defined forms of congenital heart disease. The only problems with those studies were that the total numbers in each type of congenital heart disease were quite small, and prolonged follow-up until death of all the patients with a given lesion was not possible.
A second approach would be to examine a large series of untreated subjects with a particular form of congenital heart disease at a given time (cross-sectional study). For example, if 50% of untreated subjects with tetralogy of Fallot were over 10 years old, then the cumulative mortality would be 50% by 10 years. (A crucial assumption is that the group of patients is representative of all those patients, and this will be discussed below.) This crosssectional approach also requires stationarity; that is, a group of children born in any year would have to have had the same nat ural history as a similar group born in any other year. Once again, the requirements for accurate diagnosis and the absence of any treatment cannot be completely fulfilled. One way of dealing with the need for precise clinical diagnosis would be to examine data obtained in a series of autopsies of subjects who died for reasons other than surgical treatment of their disease. In the days prior to effective surgical treatment, precise diagnosis could be and was made by autopsy, and selection based on therapeutic possibilities was not an issue. It is, however, not always possible to determine if autopsies were done in unselected patients, or if knowledge that an institution was interested in certain types of congenital heart disease resulted in selection bias. Nevertheless, pathologists and cardiologists shared a growing interest in congenital heart diseases after 1940, and this led to large numbers of autopsies in patients with these diseases.
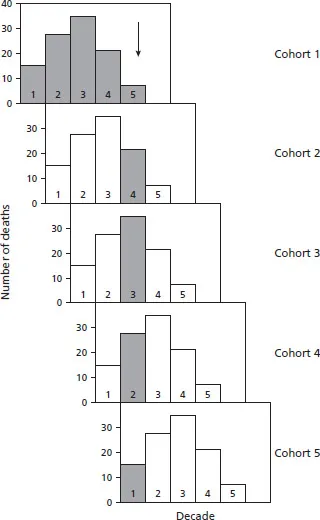
The equivalence of longitudinal and cross-sectional data (given stationarity) may not be obvious. To show their equivalence, consider a congenital anomaly in which all the patients die within five decades (Fig. 1.1).
Starting with the first cohort, there are 100 people born with this anomaly. Fourteen of them die before the end of the first decade, 26 die before 20 years of age, 33 die in the third decade, 20 in the fourth decade, and the remaining 7 in the fifth decade (top panel, shaded columns); there are no survivors over 50 years of age. One decade later another cohort is followed (second panel from top) and, assuming stationarity, follows the same course. This pattern is followed in successive decades (next three panels). Therefore, no matter which cohort we follow, 14% die under 10 years of age, 26% between 11 and 20 years of age, and so on. Any combination of first, second, third, fourth and fifth decades will give the same data. One such combination is shown in the cross-sectional data marked by the arrow and the vertical shaded columns. There are 14 dead under 10 years of age, 26 dying between 11 and 20 years of age, 33 dying between 21 and 30 years of age, and so on. If there is stationarity, then the numbers dying in each decade will be the same for longitudinal as for cross-sectional studies.
The same data plotted as survival curves are shown in Fig. 1.2.
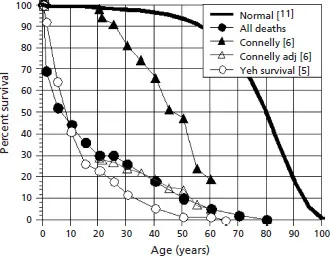
This analysis assumes that we have data on the ages at death. However, we can use the ages at which patients enter an institution to obtain similar information; certain caveats are discussed below. If the numbers of patients presenting to hospital or clinic are, by decade, 14, 26, 33, 20, and 7, then the cumulative numbers are 14 by 10 years of age, 40 by 20 years, 73 by 30 years, 93 by 40 years, and 100 by 50 years. If 14% of all the patients admitted are under 10 years of age, then there must be 86% of patients who are alive after 10 years of age. If 40% of patients have appeared by 20 years of age, then there must be 60% who are alive after 20 years of age, and so on. Calculating the numbers appearing at each subsequent age yields the same survival curve as shown in Fig. 1.2. A demonstration of the equivalence of age at death in autopsy data and age of appearance in a clinical series is shown in Fig. 1.3.
Figure 1.1 Sequential deaths by decade for five longitudinal studies.
Natural history is least accurate for those with cyanotic congenital heart disease. There are innumerable forms of these, each variant with its own natural history, but because numbers are small, the mixture of variants differs from series to series. For example, in pulmonary atresia with an intact ventricular septum outcome is determined by variations in the size of the ductus arteriosus, whether there are right ventricular to coronary artery sinusoidal connections, whether the main coronary arteries are connected to the aorta, the size of the hypoplastic right ventricle, and whether or not the tricuspid valve is competent. These variations are impossible to diagnose without modern diagnostic techniques or autopsy examination. Even if diagnosed, the resultant subgroups may be too small to provide accurate predictive information.
For the cross-sectional method to give an accurate estimation of the natural history, the patients in any series must represent all the patients with that particular lesion. This requirement is fulfilled if all the patients with that lesion in a region are diagnosed, or if they are a random sample of those patients. In general, patients with symptoms are likely to come to medical attention, but whether those who are asymptomatic are randomly selected is uncertain. Published series include many patients without symptoms, but there is no way of knowing what proportion they form of all such patients. If patients have prominent physical findings, such as very loud murmurs or cyanosis, they are very likely to be referred to a cardiologist. If the findings are subtle, however, diagnosis may be delayed or possibly never made at all. We know that perhaps as many as 50% of patients with atrial septal defects are not diagnosed until they are adults [7,8]. This does not matter if they are eventually diagnosed, because they will ultimately be included in the natural history statistics. If, however, some are never diagnosed, then the deduced natural history will appear worse than it really is.
Figure 1.2 Data from Fig. 1.1 replotted as survival curves. t0 to t7 represent longitudinal studies 10 years apart. Once equilibrium has been reached for cohort t6, the longitudinal and cross-sectional deaths for any given age group are the same.

Figure 1.3 The two sets of data with circles show data on congenitally corrected transposition of the great arteries; a single large clinical series (Yeh et al. [5]) and a series from pooled autopsy data (“all deaths”; see chapter 21). The data of Connelly et al. [6] to show the effects of age adjustment (Connelly adj) are discussed later.
Even the cross-sectional method breaks down as medical science advances. When cardiac surgery became safe for infants, the tendency was for all infants detected with a given lesion, for example, tetralogy of Fallot, to be corrected. This precludes developing the natural history of this lesion, and natural history must be determined from studies done years ago when early surgery was not generally available. Similarly extensive clin ical networks in many major regions detect almost all forms of congenital heart disease in the first year after birth [9,10] and the opportunity to determine the natural history today has become much more difficult if not impossible.
Survival curves
Special care must be taken when interpreting the age distribution of a series as indicating the survival curves when other features of the natural history suggest considerable longevity. Consider two congenital lesions in which prolonged survival is common: bicuspid nonstenotic aortic valve, and coronary arterial fistula. Patients with bicuspid aortic valves fare well, with few deaths under 40 years of age and a relatively steep decline after that as the valves deteriorate. This lesion may not be diagnosed until later life because the abnormal physical findings may be subtle. Patients with a congenital coronary fistula also have few early deaths, most after 40 years of age, so that the survival curve resembles that of the bicuspid valve. The coronary fistula however has a prominent and characteristic continuous murmur that leads to early referral. Consequently, the curve showing the ages at which the coronary fistulae are detected differs markedly from the curve of survival versus age (Fig. 1.4). If the curve relating detection to age were interpreted as the survival curve, then an incorrect assessment of a high early mortality would be made.
Presentation of data
If the outcome of interest is survival rather than symptoms, then survival curves for a particular type of congenital heart disease can be plotted against the reference survival for the whole population [11] (Fig. 1.5).
Figure 1.4 Data for coronary arterial fistulae (chapter 12) to show the difference between the age at clinical presentation (two left-hand curves) and age at occurrence of symptoms or death (two right-hand curves). PM, autopsy data.

This figure shows survival curves for the whole population, and generalized characteristic survival curves for those with acyanotic and cyanotic lesions. Generally, those dying young have the more severe disease than those dying late; however, many old people with acyanotic congenital heart disease have lesions that are not minimal. The consequences of an abnormal communication or obstruction depend not only on the severity of the lesion but also on the ability of the heart to deal with it.
The normal survival curve for the whole population is not fixed. It differs slightly for different years (Fig. 1.6, left panel) and for each gender (right panel).
Figure 1.5 Idealized survival curves.
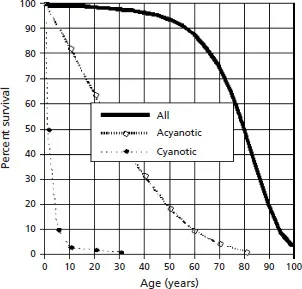
Figure 1.6 Population survival curves for three different time periods [11–13] (left panel) and the two genders [11] (right panel).
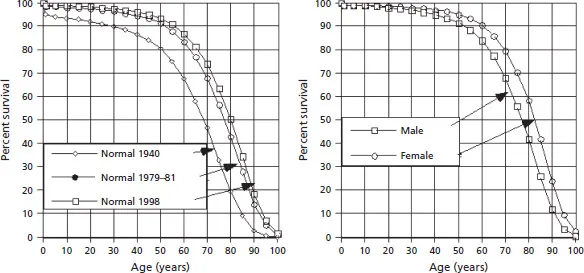
Theoretically the appropriate curves should be used for comparison with clinical outcomes, although for most publications results for men and women are not separated. For assessing natural history of congenital heart disease, however, clinical data are not accurate enough to warrant correction for these variations.
There are also differences between countries, and differences related to associated factors such as smoking. When comparing large groups with these normal data we expect these differences to be similar in control and treated populations, but if the treated population is small it may well have a different mix of genders or other factors that affect the comparison.
Survival curves are easy to plot for survival from birth. When, however, survival in a group of patients who are, for example, 40 years old is assessed, allowance must be made for the fact that these are the survivors of a larger group in which the younger members have died. This almost always means that the older subjects had less severe disease, and what happened to those with more severe disease has little bearing on the survival of these older subjects. On the other hand, the older subjects might develop myocardial or coronary arterial disease, or other noncardiac diseases that influence outcome. These older subjects therefore require their own survival curves.
There is no entirely satisfactory way of depicting (and analyzing) the outcome of surgery done at different ages. This can be illustrated in Fig. 1.7(a–d) with data taken Clarkson et al. [14] of survival after surgery for coarctation of the aorta performed at average ages of 11, 29, and 48 years.
Figure 1.7(a) shows the survival curves for all people (normal curve, thick solid line), for those with untreated coarctation of the aorta (natural history curve, solid thin line, based on pooled autopsy data), and for those operated on at three different age groups. The surgical outcomes are shown as a percent of those surviving surgery and followed for up to 20 years, and all these curves start at 100% from the origin. Survival rate is best for the youngest and worst for the oldest group, but the oldest operative group apparently does worse than those without treatment. The x-axis in fact represents two scales: one in absolute years applies to the normal and natural history curves, and the second, also in years, refers to the time after surgery for each group. In addition, although it is reasonable that older patients have a less favorable survival, the relative disadvantage of the oldest group is difficult to quantify. To allow for the difference in starting ages, we can move the origins of each surgical outcome curve to the mean age at the time of surgery (Fig. 1.7b). This puts each curve in the appropriate age range, so that the x-axis reads both absolute age and the time after surgery. However, some of the outcome curves start above the normal curve, and this is corrected simply by moving each outcome curve down to start at the appropriate age on the normal survival curve (Fig. 1.7c), reducing the 100% value to the appropriate percentage at that age on the normal survival curve, and changing the remaining postoperative survival percentages by a similar proportion. In each age group, the survival after surgery is not as good as for normal people. On the other hand, whereas in (b) it was possible to interpret the percentages surviving at different times after surgery, in (c) this cannot be done exactly without recalculating the data because now the curves do not start at 100%. Furthermore, the degree of departure from the normal curve is difficult to quantify. Finally, because patients would be expected to have less good survival than the normal population, it is difficult to interpret the improvement (if any) of the surgical outcome over the natural history. To deal with this last point, we can start each surgical outcome curve at the appropriate point on the natural history curve (Fig. 1.7d). In doing this, however, we must make allowance for the fact that a group of, say, 30-year-old people with coarctation of the aorta does not represent all with coarctation. At best, it represents all 30-year-old people with coarctation. For this reason, 100% survival of these operated patients has to be adjusted to the percentage of unoperated coarctation patients who survive to 30 years of age, about 55% (arrow A, left dashed line). If their 23 year survival after surgery is 70%, then this is equivalent to 70% × 0.55 = 38.5% (arrow B, right dashed line). (A specific example of this adjustment is shown in Fig. 1.3 where the raw data reported by Connelly et al. [6] for patients over 20 years of age are corrected to the percentage surviving to 20 years of age in the pooled autopsy series.) Figure 1.7(d) shows that, in terms of survival, surgery improves on the natural history for the two younger groups, but is little different from it in the oldest group. The natural history curve at older ages, however, is based on small numb...
Table of contents
- Cover
- Title
- Copyright
- Dedication
- Foreword
- Preface
- 1: Introduction
- 2: Surgical Procedures
- 3: Left-to-Right Shunts
- 4: Obstructive Lesions
- 5: Miscellaneous Aortic Root Lesions
- 6: Right-to-Left Shunts
- Index
Frequently asked questions
Yes, you can cancel anytime from the Subscription tab in your account settings on the Perlego website. Your subscription will stay active until the end of your current billing period. Learn how to cancel your subscription
No, books cannot be downloaded as external files, such as PDFs, for use outside of Perlego. However, you can download books within the Perlego app for offline reading on mobile or tablet. Learn how to download books offline
We are an online textbook subscription service, where you can get access to an entire online library for less than the price of a single book per month. With over 1.5 million books across 990+ topics, we’ve got you covered! Learn about our mission
Look out for the read-aloud symbol on your next book to see if you can listen to it. The read-aloud tool reads text aloud for you, highlighting the text as it is being read. You can pause it, speed it up and slow it down. Learn more about Read Aloud
Yes! You can use the Perlego app on both iOS and Android devices to read anytime, anywhere — even offline. Perfect for commutes or when you’re on the go.
Please note we cannot support devices running on iOS 13 and Android 7 or earlier. Learn more about using the app
Please note we cannot support devices running on iOS 13 and Android 7 or earlier. Learn more about using the app
Yes, you can access The Natural and Unnatural History of Congenital Heart Disease by Julien I. E. Hoffman in PDF and/or ePUB format, as well as other popular books in Medicine & Cardiology. We have over 1.5 million books available in our catalogue for you to explore.