![]()
C
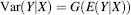
calibration Consider a situation in which we wish to measure serum concentrations of hormones, enzymes and other proteins, for example, using such methods as radio-immunoassays (RIA) and enzyme-linked immunosorbent assays (ELISA). Three key questions in the development of such assays are (a) how does the expected value (average) of the assay response change as a function of the true amount of the target material in the serum samples, (b) how does the VARIANCE (or STANDARD DEVIATION) of the assay results change with the average assay result and, subsequently, (c) how might we use a particular assay result to determine the amount of the target material in a new sample of serum? We leave question (c) for the time being and concentrate on questions (a) and (b). Let the assay response be Y and let the true level of the target material be X. We wish to determine the form of the functions F and G in the following two equations:
and
Here we assume that the values of X are known without MEASUREMENT ERROR. We are concerned with what is often referred to as absolute calibration. If we do not have access to the truth, but only have measurements using alternative assays, Y1 and Y2, say, then we are concerned with the problem of comparative calibration (for the latter see METHOD COMPARISON STUDIES). Typically, such a univariate calibration study involves performing the assay procedure (ideally with full, independent, replications) on each of N training samples or specimens with known values of X, and then using various data analytic and modelling procedures to evaluate the form of F and G. The statistical methods might be fully parametric (fitting linear or nonlinear models, for example, with an assumed parametric model for the variance) or nonparametric (essentially fitting an arbitrarily shaped smooth dose–response curve).
Suppose an analytical chemist wishes to use some form of absorption spectroscopy to study the composition of, say, certain body fluids. He or she is likely to use measurements of many peak heights from such spectra to measure several substances simultaneously. This activity is the multivariate analogue of the univariate case; i.e. multivariate calibration. Technically, multivariate calibration is much more difficult than the simpler univariate problem, but the ultimate aims and logic are similar. We start with the latter and then briefly discuss the former.
Instead of dealing with the technical complexities of fitting nonlinear models with heterogeneous error distributions, we will consider an example that, by comparison, appears to be quite simple. Suppose we have a simple colorimetric assay for urinary glucose. We obtain a series of specimens with known glucose concentrations (X) and then measure the absorbance (Y) using the relevant assay procedure. We assume that the calibration function F is a straight line and that the variance of the Y measurements is independent of X (i.e. the ‘error’ variance is constant). Fitting a simple linear regression model for Y using ordinary least squares gives us estimates of the intercept (α) and slope (β) of the straight line relating X to Y. Having answered questions (a) and (b) using the simple regression analysis, we now move on to question (c). Suppose we are presented with a new urine specimen and are asked to determine its glucose content.
The classical method of estimating the unknown X from our measurement, Y, involves using information from the above regression of Y on X. The required estimate is given by:
An alternative is the so-called inverse estimator suggested by Krutchkoff (1967). This involves using the original X, Y data to regress X on Y to obtain estimates of the intercept (c) and slope (λ), and then simply using these parameter estimates to predict X given a new Y1, i.e.:
For details of the properties of these two estimators, see the review by Osborne (1991).
To illustrate the ideas of multivariate calibration, consider a relatively simple example. Suppose we wish to measure the concentration of a particular metabolite in the blood (X) but we are now able to use, say, three different colorimetric assay procedures to obtain values Y1, Y2 and Y3. Assuming that the three corresponding calibration curves (F1, F2 and F3), as before, are all straight lines (but with different intercepts, slopes and ‘error’ variances) we can use MULTIVARIATE LINEAR REGRESSION (or three separate regressions) in order to estimate the parameters of the three calibration curves. The classical approach to the use of anew set of three measurements (Y1,Y2 and Y3) on a new specimen to predict an unknown X is the multivariate generalisation of the univariate problem. Details of multivariate calibration are well beyond the scope of the present article, however, and readers are referred to Thomas (1994) and Naes et al. (2002) for further information. Considering our present example, one simple approach (particularly if we are prepared to assume conditional independence of the Y values) might involve estimating the unknown X using each of the Y1, Y2 and Y3 values separately (in each case using equation (3) above) and then producing a weighted average of these three estimates, with weights proportional to their estimated precision. An example of the inverse approach would be to produce a multiple regression to predict the unknown X from the three Y measurements. This has obvious technical drawbacks, however, because of MULTICOLLINEARITY (high correlations between the three Y values). One possible solution involves the use of principal components regression. A PRINCIPAL COMPONENTS ANALYSIS is carried out on the Y values and then one or more of the resulting components are used to predict the unknown X. Further details of principal components regression and alternative analytical strategies can be found in Thomas (1994) and Naes et al. (2002). Whatever method of prediction is used, however, it is important in both univariate and multi-variate calibration problems that the performance of the predictions are adequately evaluated. This might involve validation using a test set of new X, Y values or internal cross-validation (use of the LEAVE-ONE-OUT CROSS-VALIDATIONapproach, for example) using the original training set. GD
Krutchkoff,R.G.1967: Classical and inverse regression methods of calibration. Technometrics 9, 425–39. Naes, T., Isaksson,T., Fearn, T. and Davies, T. 2002: A user-friendly guide to multivariate calibration and classification. Chichester, UK: NIR Publications. Osborne, C. 1991: Statistical calibration: a review. International Statistical Review 59, 309–36. Thomas, E. V. 1994: A primer on multivariate calibration. Analytical Chemistry 66, 795A–804A.
caliper matching See MATCHING
canonical correlation analysis This technique establishes whether relationships exist between a priori groups of variables in a study. For example, in a study of heart disease, we might ask if there is a connection between personal physical characteristics such as age, weight and height, on the one hand, and the systolic and diastolic blood pressures of the individuals, on the other. Alternatively, in chronic depression, a study might be aimed at uncovering relationships between personal social and financial variables such as gender, age, educational level, income and a range of health variables including various indicators of depression. In another example, a public health survey might be conducted to explore connections between housing quality variables and indicators of different illnesses.
A first attempt at analysing the strength of association between two groups of variables (e.g. between housing quality and illness) might involve examination of all correlations between pairs of variables, one from each group. However, if each group contains more than just a few variables, such an approach is bound to lead to confusion. Ideally, one would like to replace each set of original variables by a new set, in such a way that the new variables were mutually uncorrelated within sets and just a few of them exhibited correlation between sets. Canonical correlation analysis takes just such an approach, and finds optimal sets of linear transformations of the original variables, one for each original group of variables. Suppose that u1, u2, …, us are the transformed variables for one set (say, the housing quality variables), while v1, v2, …, vs are the transformed variables for the other set (say, the illness variables).
‘Optimality’ is defined by requiring the correlation between u1 and v1 to be as large as possible among all linear combinations of the original variables, that between u2 and v2 to be the next largest, that between u3 and v3 the third largest and so on, subject to the following constraints: u1, u2, …, us are mutually uncorrelated; v1, v2, …, vs are mutually uncorrelated; and any ui, vj pair is uncorrelated when i = j.
It is clearly not possible to have more (uncorrelated) transformed variables than there were original variables in a set, so the numbers of pairs that can be derived is equal to the smaller of the numbers of original variables in the two groups.
The effect of canonical correlation analysis is thus to channel all the association between the two groups of variables through the resulting pairs of linear combinations (u1,v1), (u2,v2), …. These derived variables are known as canonical variates. The only nonzero correlations remaining in the correlation matrix of the new variables are those between corresponding pairs of canonical variates, i.e. between ui and vi for i = 1, …, s; they are known as the canonical correlations of the system. Most computer software packages that contain multivariate statistical procedures will conduct such an analysis. They will also quote a significance level against each canonical correlation, appropriate for testing the NULL HYPOTHESISthat all succeeding population canonical correlations are zero. Such significance levels should be treated with some caution, as they rely on the assumption that the data follow a MULTIVARIATE NORMAL DISTRIBUTION. Nonetheless, the number of significant canonical correlations is usually taken to indicate the number of (independent) connections that exist between the two groups of variables.
Inspection of the coefficients of each original variable in each canonical variate may also provide an interpretation of the canonical variate in the same manner as interpretation of principal components, which may help to identify the nature of the connection between the groups (see PRINCIPALCOMPONENT ANALYSIS). However, again a cautionary note is in order, because such interpretation is not quite as straightforward as for principal components. The reason for the complication is that there may be very diverse VARIANCES and covariances (see COVARIANCE MATRICES) among the original variables in the two groups, which affects the sizes of the coefficients in the canonical variates, and there is no convenient normalisation to place all coefficients on an equal footing. This drawback can be alleviated to some extent by restricting interpretation to the standardised coefficients, i.e. the coefficients that are appropriate when the original variables have been standardised, but nevertheless the problem still remains.
To illustrate the technique, consider a canonical correlation analysis between the ‘health’variables and the ‘personal’ variables in the Los Angeles depre...