This much needed, comprehensive and modern reference on display technology, illumination sources and color imaging focuses on visual effects and how reproduced images are best matched to human visual features.
As such, it teaches readers how to exploit the knowledge of human color information processing to design usable, ergonomic, and pleasing displays or visual environments. The contents describe design principles and methods to optimize self-luminous visual technologies for the human user, including modern still and motion image displays, and indoor light sources. Design principles and methods are derived from the knowledge of the human visual system, with a special emphasis on color vision, color cognition, color harmony, color preference and visually evoked emotions. The expert authors include the most important and latest applications of the design principles and methods, forming a comprehensive view of human color information processing from the receptors through the retina via high-level visual perception right up to the level of cognition, preference, harmony, as well as visually evoked emotions.
This book is included in the Wiley SID Series.
eBook - ePub
Illumination, Color and Imaging
Evaluation and Optimization of Visual Displays
- English
- ePUB (mobile friendly)
- Available on iOS & Android
eBook - ePub
About this book
Trusted by 375,005 students
Access to over 1.5 million titles for a fair monthly price.
Study more efficiently using our study tools.
Information
Chapter 1
Color Vision and Self-Luminous Visual Technologies
Color vision is a complicated phenomenon triggered by visible radiation from the observer's environment imaged by the eye on the retina and interpreted by the human visual brain [1]. A visual display device constitutes an interface between a supplier of electronic information (e.g., a television channel or a computer) and the human observer (e.g., a person watching TV or a computer user) receiving the information stream converted into light. The characteristics of the human component of this interface (i.e., the features of the human visual system such as visual acuity, dynamic luminance range, temporal sensitivity, color vision, visual cognition, color preference, color harmony, and visually evoked emotions) cannot be changed as they are determined by biological evolution.
Therefore, to obtain an attractive and usable interface, the hardware and software features of the display device (e.g., size, resolution, luminance, contrast, color gamut, frame rate, image stability, and built-in image processing algorithms) should be optimized to fit the capabilities of human vision and visual cognition. Accordingly, in this chapter, the most relevant characteristics of human vision – especially those of color vision – are introduced with special respect to today's different display technologies.
The other aim of this chapter is to present a basic overview of some essential concepts of colorimetry [2] and color science [3–5]. Colorimetry and color science provide a set of numerical scales for the different dimensions of color perception (so-called correlates for, for example, the perceived lightness or saturation of a color stimulus). These numerical correlates can be computed from the result of physical light measurement such as the spatial and spectral light power distributions of the display. Using these numerical correlates, the display can be evaluated and optimized systematically by measuring the spectral and spatial power distributions of their radiation – without cumbersome and time-consuming direct visual evaluations.
1.1 Color Vision Features and the Optimization of Modern Self-Luminous Visual Technologies
This section summarizes the most important features of color vision for the evaluation and optimization of self-luminous color displays including the photoreceptor structure of the retina, the spatial and temporal contrast sensitivity of the human visual system, color appearance and color difference perception, the components of visual performance and ergonomics (legibility, visibility, and conspicuity of colored objects), and certain features arising at a later stage of human visual information processing such as cognitive, preferred, harmonic, and emotional color phenomena. The important issue of interindividual variability of color vision will also be dealt with in this section.
1.1.1 From Photoreceptor Structure to Colorimetry
Human color vision is trichromatic [1]. This feature has its origin in the retinal photoreceptor structure consisting of three types of photoreceptors that are active at daytime light intensity levels: the L-, M-, and S-cones. Rods constitute a further type of retinal photoreceptors but as they are responsible for nighttime vision and partially for twilight viewing conditions, they are out of the scope of this book. Displays should ensure a high enough general luminance level (e.g., higher than 50–100 cd/m2, depending on the chromaticity of the stimulus) for the three types of cones to operate in an optimum state for the best possible perception of colors. Generally, above a luminance of about 100 cd/m2, rods produce no signal for further neural processing and it is possible to predict the matching and the appearance of colors from the cone signals only.
L-, M-, and S-cones constitute a characteristic retinal cone mosaic. The central (rod-free) part of the cone mosaic can be seen Figure 1.1.
Figure 1.1 The cone mosaic of the rod-free inner fovea, that is, the central part of the retina subtending about 1°, that is, about 300 µm. Red dots: long-wavelength sensitive cone photoreceptors (L-cones). Green dots: middle-wavelength sensitive cones (M-cones). Blue dots: short-wavelength sensitive cones (S-cones).
Source: Figure 1.1 from Sharpe, L.T., Stockman, A., Jägle, H., and Nathans, J. (1999) Opsin genes, cone photopigments, color vision and color blindness, in Ref. [1], pp. 3–51. Reproduced with permission from Cambridge University Press.
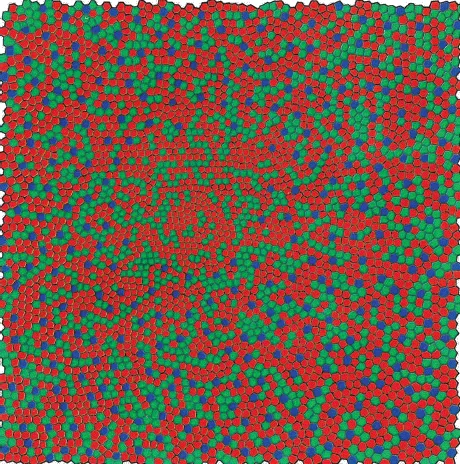
As can be seen from Figure 1.1, the inner area of the central part (subtending a visual angle of about 0.3° or 100 µm) is free of S-cones resulting in the so-called small-field tritanopia, that is, the insensitivity to bluish light for very small central viewing fields. There are on average 1.5 times as many L-cones as M-cones in this region of the retina [1]. L- and M-cones represent 93% of all cones, while S-cones represent the rest (7%).
Spectral sensitivities of the three types of cones [1] are depicted in Figure 1.2, while a more extensive database of the characteristic functions describing human color vision can be found on the Web . These cone sensitivities were measured at the cornea of the eye; hence, they include the filtering effect of the ocular media and the central yellow pigment on the retina (so-called macular pigment). Sensitivity curves were adjusted to the average relative numbers of the L-, M-, and S-cones, that is, 56, 37, and 7%, respectively.
Figure 1.2 Spectral sensitivities of the three types of cones measured in quantal units (to obtain energy units, add log(λ) to each value and renormalize [1]) as measured at the cornea of the eye, thus containing the filtering effect of the ocular media and the macular pigment. Sensitivities adjusted to average relative numbers of L-, M-, and S-cones (i.e., 56, 37, and 7%, respectively).
Source: Figure 1.1 from Sharpe, L.T., Stockman, A., Jägle, H., and Nathans, J. (1999) Opsin genes, cone photopigments, color vision and colorblindness, in Ref. [1], pp. 3–51. Reproduced with permission from Cambridge University Press.
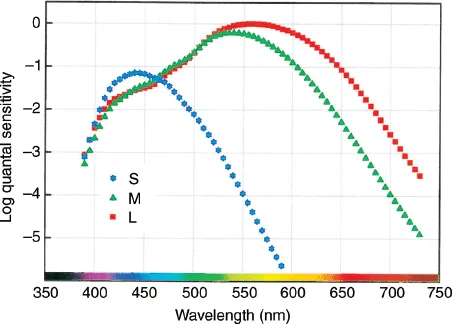
As can be seen from Figure 1.2, the spectral bands of the L-, M-, and S-cones provide three initial color signals like the CCD or CMOS array of a digital camera. From these initial color signals, the retina computes two chromatic signals (or chromatic channels), L − M (red–green opponent channel) and S − (L + M) (yellow–blue opponent channel), and one achromatic signal, L + M. The latter signal is called luminance signal or luminance channel. As can be seen from Figure 1.2, the maxima of the L-, M-, and S-sensitivity curves in Figure 1.2 occur at 566, 541, and 441 nm, respectively [1]. Note that these spectral sensitivity curves are expressed in quantal units. To express them in energy units, the logarithm of the wavelength should be added to each value and the curve renormalized [1].
For stimuli subtending a visual angle of 1–4°, the spectral sensitivity of the luminance channel is usually approximated by the V(λ) function, the spectral luminous efficiency function for photopic vision also defining the CIE standard photometric observer for photopic vision (the basis of photometry) [2]. The V(λ) function seriously underestimates the spectral sensitivity of the luminance channel at short wavelengths1).
Due to historical reasons, the spectral sensitivities of the three types of cones (Figure 1.2) are currently not widely used to characterize the radiation (so-called color stimulus) reaching the human eye and resulting in color perceptions. Instead of that, for color stimuli subtending a visual angle o...
Table of contents
- Cover
- Wiley-SID Series in Display Technology
- Title Page
- Copyright
- Dedication
- Series Editor's Foreword
- Preface
- About the Authors
- Chapter 1: Color Vision and Self-Luminous Visual Technologies
- Chapter 2: Colorimetric and Color Appearance-Based Characterization of Displays
- Chapter 3: Ergonomic, Memory-Based, and Preference-Based Enhancement of Color Displays
- Chapter 4: Color Management and Image Quality Improvement for Cinema Film and TV Production
- Chapter 5: Pixel Architectures for Displays of Three- and Multi-Color Primaries
- Chapter 6: Improving the Color Quality of Indoor Light Sources
- Chapter 7: Emerging Visual Technologies
- Index
Frequently asked questions
Yes, you can cancel anytime from the Subscription tab in your account settings on the Perlego website. Your subscription will stay active until the end of your current billing period. Learn how to cancel your subscription
No, books cannot be downloaded as external files, such as PDFs, for use outside of Perlego. However, you can download books within the Perlego app for offline reading on mobile or tablet. Learn how to download books offline
Perlego offers two plans: Essential and Complete
- Essential is ideal for learners and professionals who enjoy exploring a wide range of subjects. Access the Essential Library with 800,000+ trusted titles and best-sellers across business, personal growth, and the humanities. Includes unlimited reading time and Standard Read Aloud voice.
- Complete: Perfect for advanced learners and researchers needing full, unrestricted access. Unlock 1.5M+ books across hundreds of subjects, including academic and specialized titles. The Complete Plan also includes advanced features like Premium Read Aloud and Research Assistant.
We are an online textbook subscription service, where you can get access to an entire online library for less than the price of a single book per month. With over 1.5 million books across 990+ topics, we’ve got you covered! Learn about our mission
Look out for the read-aloud symbol on your next book to see if you can listen to it. The read-aloud tool reads text aloud for you, highlighting the text as it is being read. You can pause it, speed it up and slow it down. Learn more about Read Aloud
Yes! You can use the Perlego app on both iOS and Android devices to read anytime, anywhere — even offline. Perfect for commutes or when you’re on the go.
Please note we cannot support devices running on iOS 13 and Android 7 or earlier. Learn more about using the app
Please note we cannot support devices running on iOS 13 and Android 7 or earlier. Learn more about using the app
Yes, you can access Illumination, Color and Imaging by P. Bodrogi,T. Q. Khan in PDF and/or ePUB format, as well as other popular books in Technology & Engineering & Electrical Engineering & Telecommunications. We have over 1.5 million books available in our catalogue for you to explore.