![]()
Chapter 1
Genomic Variations and Marker Technologies for Genome-based Selection
Zhanjiang (John) Liu
Genetic Variations at the Genomic Level
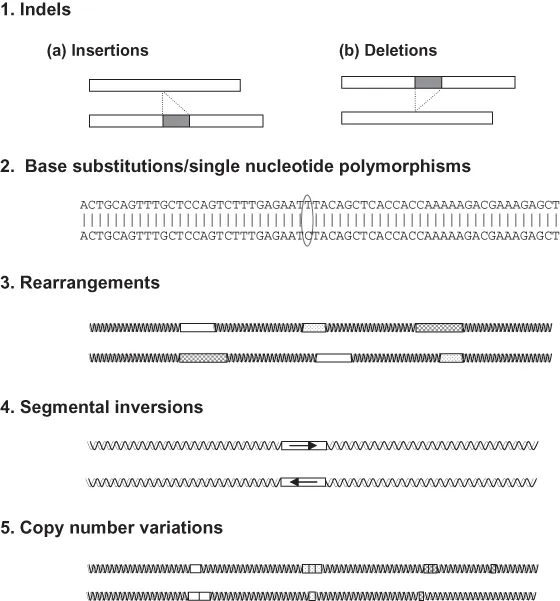
The genome compositions of each individual of the same species are similar but different at the level of DNA sequences and its encoding capacity (sometimes in terms of what genes are transcribed, but perhaps more often in terms of how much the gene products are made), and thereby have different transcriptional activities, encoding similar but different proteins, or encoding same or similar proteins in different quantities, leading to different biological characteristics and performance. Upon comparison of the genomes of individuals within a population with their reference genome sequence of the species, several general types of genetic variations can be found (Figure 1.1): (1) a deletion due to the loss of one or more of bases; (2) insertion due to gain of one or more bases; (3) base substitution at various positions; (4) inversion of a DNA segment in its orientation; (5) rearrangements of multiple DNA segments within a both small and larger scope of the genome; and (6) copy number variation (CNV) due to insertions, deletions, and duplication or multiplication of a DNA segment(s). A deletion mutation and an insertion mutation can be viewed as the same phenomenon depending on what is used as the reference. Deletions/insertions in random genomic locations probably do not have much impact to its biological activities except when deletion/insertion happens within a gene or within its regulatory elements. Insertion/deletion of single base or two bases within a protein coding sequence would cause frameshift of the protein being encoded, thus leading to the completely different amino acid sequences downstream of the mutation. However, deletion/insertion of three bases or multiple of three bases (e.g., 6 base pair [bp], 9 bp) within a protein coding sequence would cause a deletion of one amino acid or multiple amino acids depending on the extent of the deletion/insertion. In the first case of deletion/insertion of one or two bases into a protein coding sequences, the biological impact could be highly significant. Such mutations could cause total loss of functions of the protein. In the later case, deletion/insertion of three or multiple of three bases would lead to a protein missing one or a few amino acids but the upstream and downstream amino acid sequences should still be the same. In this case, the protein function may or may not be altered depending on the position of the mutation and the amino acids involved. Serious biological impact can still result. For instance, in the case cystic fibrosis (CF), a 3-bp deletion at the amino acid position of 506 of the cystic fibrosis transmembrane regulator (CFTR) protein would lead to the most serious form of CF, even though the resulting protein losses just one amino acid.
Genome variations involve a wide range of segmental inversions or rearrangements. Very similar to the situation of deletions and insertions, such sequence changes could have huge biological impact depending on the location of the mutation and the genes or gene regulatory sequences involved in such mutations.
The most widespread genomic variation among individuals within a population is base substitution. Such base substitution along the DNA chain is defined as single-nucleotide polymorphisms (SNPs).
Inversion of a DNA segment in its orientation can be quite widespread in the genome, but this type of variation have not been well studied and probably will not be very useful for large-scale genomic studies.
CNV due to insertions, deletions, and duplication or multiplication of a DNA segment is widespread, and this type of genomic variation caught the attention of genome researchers just recently. CNV can involve large or small genome segments that are duplicated or multiplied in one genome while not in another. Such CNVs can involve genes or just genomic segments that do not harbor genes. Obviously, when genes are involved, the duplicated or multiplied genes can affect genome expression activities. The significance of CNV has caught much attention recently, and CNV could potentially be used for whole genome selection programs upon identification of correlation or causation of certain genome segments with performance traits. The importance of CNV in teleost fish is further signified by the fact that teleost fish had an additional round of genome duplication followed with random gene loss, thereby resulting in various CNV situations involving various genes. Because of this significance, CNV is included as an independent chapter in this book (Chapter 2).
A Review of DNA Marker Technologies
The entire task of DNA marker technologies is to provide the means to reveal DNA-level differences of genomes among individuals of the same species, as well as among various related taxa. Historically, these measurements relied on phenotypic or qualitative markers. Morphological differences such as body dimensions, size, and pigmentation are some examples of phenotypic markers. Genetic diversity measurements based on phenotypic markers are often indirect, and are inferential through controlled breeding and performance studies (Parker et al., 1998; Okumu
and Çiftci, 2003). Because these markers are polygenically inherited and have low heritability, they may not represent the true genetic differences (Smith and Chesser, 1981). Only when the genetic basis for these phenotypic markers is known can some of them be used to measure genetic diversity. Molecular markers including protein markers and DNA markers were developed to overcome problems associated with phenotypic markers.
Allozyme Markers
Much before the discovery of DNA markers, allozyme markers were used to identify broodstocks in fish and other aquaculture species (Kucuktas and Liu, 2007). Allozymes are different allelic forms of the same enzymes encoded at the same locus (Hunter and Markert, 1957; Parker et al., 1998; May, 2003). Genetic variations detected in allozymes may be the result of point mutations, insertions, or deletions (indels). Allozymes have had a wide range of applications in fisheries and aquaculture including population analysis, mixed stock analysis, and hybrid identification (May, 2003). However, they are becoming a marker type of the past due to the limited number of loci that in turn prohibits genome-wide coverage for the analysis of complex traits (Kucuktas and Liu, 2007). In addition, mutation at the DNA level that causes a replacement of a similarly charged amino acid may not be detected by allozyme electrophoresis. Another drawback is that the most commonly used tissues in allozyme electrophoresis are the muscle, liver, eye, and heart, the collection of which is lethal.
Restriction Fragment Length Polymorphism (RFLP)
Two specific technological advances, the discovery and application of restriction enzymes in 1973 and the development of DNA hybridization techniques in 1975, set the foundation for the development of the first type of DNA markers, RFLP (for a recent review, see Liu, 2007a). Restriction endonucleases cut DNA wherever their recognition sequences are encountered. Therefore, changes in the DNA sequence due to insertions/deletions (indels), base substitutions, or rearrangements involving the restriction sites can result in the gain, loss, or relocation of a restriction site. Digestion of DNA with restriction enzymes results in fragments whose number and size can vary among individuals, populations, and species. Two approaches are widely used for RFLP analysis. The first involves the use of Southern blot hybridization (Southern, 1975), while the second involves the use of PCR. Traditionally, fragments were separated using Southern blot analysis, in which genomic DNA is digested, subjected to electrophoresis through an agarose gel, transferred to a solid support such as a piece of nylon membrane, and visualized by hybridization to specific probes. Most recent analysis replaces the tedious Southern blot analysis with techniques based on polymerase chain reaction (PCR). If flanking sequences are known for a locus, the segment containing the RFLP region is amplified via PCR. If the length polymorphism is caused by a deletion or insertion, gel electrophoresis of the PCR products should reveal the size difference. However, if the length polymorphism is caused by base substitution at a restriction site, PCR products must be digested with a restriction enzyme to reveal the RFLP.
The major strength of RFLP markers is that they are codominant markers; that is, both alleles in an individual are observed in the analysis. The major disadvantage of RFLP is the relatively low level of polymorphism. In addition, either sequence information (for PCR analysis) or a molecular probe (for Southern blot analysis) is required, making it difficult and time-consuming to develop markers in species lacking known molecular information. Due to these disadvantages, the application of RFLP markers in aquaculture and fisheries has been, and will be, limited.
Mitochondrial Markers
Mitochondrial genome evolves more rapidly than the nuclear genome. The rapid evolution of the mitochondrial DNA (mtDNA) makes it highly polymorphic within a given species. The polymorphism is especially high in the control region (D-loop region), making the D-loop region highly useful in population genetic analysis. The analysis of mitochondrial markers is mostly RFLP analysis, or direct sequence analysis (Liu and Cordes, 2004). Due to the high levels of polymorphism and the ease of mtDNA analysis, mtDNA has been widely used as markers in aquaculture and fisheries settings. However, mtDNA is maternally inherited in most cases, and this non-Mendelian inheritance greatly limits the applications of mtDNA for genome research. In addition, most aquaculture-related traits are controlled by nuclear genes. For most aquaculture finfish species, their nuclear genome is at the level of a billion base pairs, while their mitochondrial genomes are usually tens of thousands of times smaller than the nuclear genome. Clearly, in spite of their usefulness for the identification of aquaculture stocks, mtDNA markers will not be tremendously useful for aquaculture genome research and genetic improvement programs in aquaculture. However, some recent studies suggested that mtDNA could influence performance traits such as growth (Steele et al., 2008).
Microsatellite Markers
When the Human Genome Project was launched in the mid-1980s, the capacity and capabilities of available DNA marker technologies seriously limited genome research. Such severe limits put pressure to develop more efficient marker systems for analysis of complex traits and genome organizations. At the end of 1980s, the simple sequence repeats (SSRs) or microsatellites were discovered; and they have since been used as one of the most preferred marker types because of their high levels of polymorphism, abundance, roughly even genome distribution, codominant inheritance, and small locus size that facilitate PCR-based genotyping (Tautz, 1989).
Microsatellites can be viewed as special cases of insertions or deletions. An addition of a dinucleotide microsatellite repeat can be viewed as an insertion of 2 bp into the genome. They are perhaps the most abundant type of insertions and deletions.
Microsatellites are SSRs of 1–6 bp. They are highly abundant in various eukaryotic genomes including all aquaculture species studied to date. In most of the vertebrate genomes, microsatellites make up a few percent of the genome in terms of the involved base pairs, depending on the compactness of the genomes. Generally speaking, more compact genomes tend to contain smaller proportion of repeats including SSRs, but this generality is not always true. For example, the highly compact genome of Japanese pufferfish contains 1.29% of microsatellites, but its closely related Tetraodon nigroviridis genome contains 3.21% of microsatellites (Crollius et al., 2000). During a genomic sequencing survey of channel catfish, microsatellites were found to represent 2.58% of the catfish genome (Xu et al., 2006; Liu et al., 2009). In fugu, one microsatellite was found for every 1.87 kb of DNA. For comparison, in the human genome, one microsatellite was found for every 6 kb of DNA (Beckmann and Weber, 1992). It is reasonable to predict that in most aquaculture fish species, one microsatellite should exist every 10 kb or less of the genomic sequences, on average.
Dinucleotide repeats are the most abundant forms of microsatellites. For instance, in channel catfish, 67.9% of all microsatellites are present in the form of dinucleotide repeats; 18.5% are present as trinucleotide repeats; and 13.5% as tetranucleotide repeats. Of the dinucleotide repeat types, (CA)n is the most common dinucleotide repeat type, followed by (AT)n, and then (CT)n (Toth et al., 2000; Xu et al., 2006). (CG)n type of repeats is relatively rare in the vertebrate genomes. Partially, this is because the vertebrate genomes are often A/T-rich. Of the trinucleotide repeats and tetranucleotide repeats, relatively A/T-rich repeat types are generally more abundant than G/C-rich repeat types. Microsatellites longer than tetranucleotide repeats (penta- and hexanucluotides) are much less abundant, and are therefore are less important as molecular markers (Toth et al., 2000). It is important to point out that the definition of microsatellites limiting to repeats of six bases long are quite arbitrary. Technically speaking, repeats with seven bases or longer sequences are also microsatellites, but because they become rarer as the repeats are longer, they are less relevant as molecular markers.
Microsatellites are distributed in the genome on all chromosomes and all regions of the chromosome. They have been found inside gene coding regions (e.g., Liu et al., 2001), introns, and in the nongene sequences (Toth et al., 2000). The best known examples of microsatellites within coding regions are those causing genetic diseases in humans, such as the CAG repeats that encode polyglutamine tract, resulting in mental retardation. In spite of ...