![]()
Chapter 1
Introduction
Six Sigma is a strategic approach that works across all processes, products and industries.
(Snee, 2004, p. 8)
Overview
In an overview of Six Sigma, Montgomery and Woodall (2008) state:
Six Sigma is a disciplined, project-oriented, statistically based approach for reducing variability, removing defects, and eliminating waste from products, processes, and transactions. The Six Sigma initiative is a major force in today's business world for quality and business improvement. Statistical methods and statisticians have a fundamental role to play in this process.
This book is about the understanding and implementation of statistical methods fundamental to the Six Sigma and other approaches to the continuous improvement of products, processes and services. Release 16 of the widely used statistics package Minitab is used throughout. Mindful that in the vast majority of situations those applying statistical methods in quality improvement and Six Sigma are not statisticians, information on the implementation of each method covered will be preceded by some background explanation, typically employing small data sets. The role of each method within the define–measure–analyse–improve–control (DMAIC) framework of Six Sigma will be highlighted.
This chapter deals with quality and quality improvement and in particular with the highly successful Six Sigma approach to quality improvement. It describes the role of statistical methods in quality improvement and Six Sigma and outlines how Minitab can be used to implement these methods.
1.1 Quality and Quality Improvement
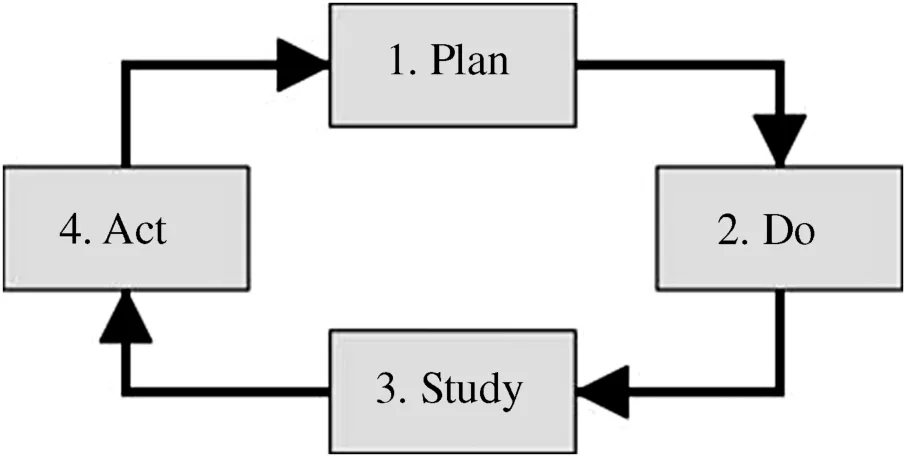
Definitions of quality abound. Wheeler and Chambers (1992, p. xix) define quality as being ‘on-target with minimum variance’. They state that operating ‘on-target’ requires a different way of thinking about processes and that operating with ‘minimum variance’ can only be achieved when a process is behaving in a reasonably stable and predictable way. Wheeler and Poling (1998, p. 3) state that continual improvement requires a ‘methodology for studying processes and systems, and a way of differentiating between the different types of variation present in processes and systems’. They refer to the cycle of activities involved in continual improvement as the plan–do–study–act (PDSA) cycle – see Figure 1.1 (Wheeler and Poling, 1998, p. 5), reproduced by permission of SPC Press, Inc. This cycle of activities is often referred to as the Shewhart–Deming cycle in honour of two key figures in the development of quality improvement methodology, Dr Walter A. Shewhart and Dr W. Edwards Deming.
In 1988 the author had the pleasure, along with some 400 others, of attending a seminar for statisticians by the late Dr Deming at the University of Nottingham. In his presentation handout he described the cycle as follows (Deming, 1988, p. 33):
- Plan – Plan a change or test, aimed at improvement.
- Do – Carry it out, preferably on a small scale.
- Study – Study the results. What did we learn?
- Act – Adopt the change or abandon it or run through the cycle again, possibly under different environmental conditions.
In his book Out of the Crisis, Deming (1986, p. 23) listed 14 Points for Management, including the following:
- Constancy of purpose – create constancy of purpose for continual improvement of products and service.
- Improve every process – improve constantly and forever every process for planning, production and service.
- Eliminate targets – substitute aids and helpful supervision; use statistical methods for continual improvement.
Thus the Deming philosophy of quality improvement advocates never-ending continual improvement of all processes within an organization. The improvement process itself should be structured and employ statistical methods. ‘Improvement nearly always means reduction of variation’ (Deming, 1988).
1.2 Six Sigma Quality Improvement
Six Sigma is one of a number of quality improvement strategies based on the Shewhart–Deming PDSA cycle. Truscott devotes a chapter to comparison of Six Sigma with other quality improvement initiatives. He puts Six Sigma in perspective earlier in his book as follows (Truscott, 2003, p. 1):
Six Sigma focuses on establishing world-class business-performance benchmarks and on providing an organizational structure and road-map by which these can be realized. This is achieved mainly on a project-by-project team basis, using a workforce trained in performance-enhancement methodology, within a receptive company culture and perpetuating infrastructure. Although particularly relevant to the enhancing of value of products and services from a customer perspective, Six Sigma is also directly applicable in improving the efficiency and effectiveness of all processes, tasks and transactions within any organization. Projects are thus chosen and driven on the basis of their relevance to increased customer satisfaction and their effect on business-performance enhancement through gap analysis, namely, prior quantitative measurement of existing performance and comparison with that desired.
Six Sigma originated at Motorola Inc. as a long-term quality improvement initiative entitled ‘The Six Sigma Quality Program’. (Six Sigma® is a registered trademark and service mark of Motorola Inc.) It was launched by the company's chief executive officer, Bob Galvin, in January 1987 with a speech that was distributed to everyone in the organization. In the speech Galvin reported on many visits to customers in the previous six months during which desires were expressed for better service from Motorola in terms of delivery, order completeness, accurate transactional records etc. The customers had also indicated that, with better service and an emphasis on total quality, Motorola could expect an increase of between 5% and 20% in future business from them. He therefore challenged employees to respond urgently to make the necessary improvements, emphasized the leadership role of management in the implementation of the programme and announced that Motorola's corporate quality goal had been updated accordingly. The goal included the objective ‘Achieve Six Sigma capability by 1992’ (Perez-Wilson, 1999, p. 131).
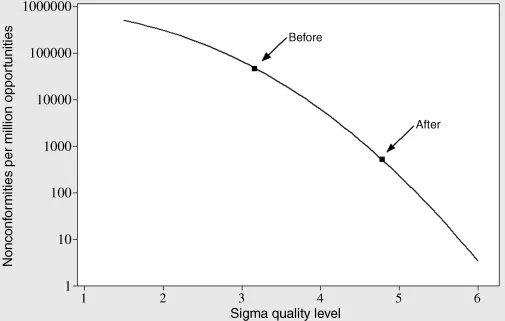
In addition to being a strategy for the continual improvement of quality within organizations, Six Sigma indicates a level of performance equating to 3.4 nonconformities per million opportunities, a level which some regard as being ‘world-class performance’. This often leads to confusion. In this book the phrase ‘sigma quality level’ will be used for this indicator of process performance, as advocated by Breyfogle (2003, p. 3). Thus a sigma quality level of 6 equates to 3.4 nonconformities per million opportunities. The link between sigma quality level and number of nonconformities per million opportunities will be explained in detail in Chapter 2. Table 1.1 gives some sigma quality levels and corresponding numbers of nonconformities per million opportunities.
Table 1.1 Sigma quality levels and nonconformities per million opportunities.
| 1.5 | 501 350 |
| 2.0 | 308 770 |
| 2.5 | 158 687 |
| 3.0 | 66 811 |
| 3.5 | 22 750 |
| 4.0 | 6 210 |
| 4.5 | 1 350 |
| 5.0 | 233 |
| 5.5 | 32 |
| 6.0 | 3.4 |
The plot in Figure 1.2 (created using Minitab) shows nonconformities per million opportunities plotted against sigma quality level, the vertical scale being logarithmic. Many authors refer to defects rather than nonconformities and state that a sigma quality level of 6 equates to 3.4 defects per million opportunities or 3.4 DPMO.
Imagine a bottling plant where there was concern over the number of bottles of whisky containing contaminant particles. A bottling run of 14 856 bottles had yielded 701 nonconforming bottles in terms of contamination. This corresponds to (701/14 856) × 106 = 47 186 nonconforming bottles per million. Since 47 254 lies between 22 750 and 66 811, Table 1.1 indicates a sigma quality level between 3.0 and 3.5. The more comprehensive table in Appendix 1 gives the sigma quality level as 3.17 (47 461 being the entry in the table closest to 47 186).
The main source of contamination was found to be the wax-coated corks used to seal the bottles. Dialogue with the supplier of the corks led to a trial with corks produced using a new method for application of the wax. For the trial there were 8 nonconforming bottles out of 15 841. The reader is invited to verify that this corresponds to 505 nonconforming bottles per million and a sigma quality level of 4.79. Thus the higher the sigma quality level for a process the better is its performance. The points corresponding to the situations before and after the process ch...