![]()
PART I
ETF Overview and Selection
![]()
CHAPTER 1
Why Use Technical Analysis with ETFs?
Unlike most books on exchange-traded funds (ETFs), this one offers you strategies based on technical analysis, not fundamental analysis. When I began trading professionally in 1999, before ETFs took the market by storm, people tried to convince me of the merits of studying fundamental factors, such as price-to-earnings (P/E) ratios, balance sheets, earnings growth, and news events. I’ve always believed that a deep knowledge of these items is theoretically important, but fundamentals seem to have a direct impact only on the long-term direction of a stock. In the short to intermediate term, the correlation between the actual price action of an ETF and its fundamentals is rarely significant. Technical analysis, however, tells me everything I need to know about the odds of a trade continuing in the current direction or reversing.
Because an ETF consists of a diverse plethora of individual stocks, using fundamental analysis of the underlying stocks to predict the price movement of the actual ETF brings less than satisfactory results. The only way to have a greater than 50–50 chance of predicting the short- and intermediate-term trends of ETFs is through sound technical analysis. This is why my hedge fund, Morpheus Capital LP, is one of the few professional hedge funds that primarily bases its investment and trading decisions on the technical analysis strategies I share with you in this book, rather than more traditional fundamental analysis and “long-term” investing. Although the techniques presented here are designed to work ideally with ETFs, individual stock traders can successfully apply the same techniques.
To understand the problems with a fundamentals-based system of analysis, consider the effect news events such as earnings reports often have on stocks and ETFs. How many times has a company reported what is perceived as a strong earnings report, only to see the stock price go down several points the next day? A positive price reaction to a poor earnings report is equally common. The increase or decrease in the price of the stock that can occur in anticipation of a positive or negative earnings report is one of the reasons these inverse price reactions occur. With technical analysis, however, news events are irrelevant to your analysis. The price and volume of the stock or ETF already tells you everything you need to know. If the equity has been trending higher for quite some time, odds are favorable that it will continue to do so. Likewise, a stock or ETF stuck in a protracted downtrend will remain that way until the chart pattern proves otherwise.
I have designed this book to provide a logical, step-by-step process that enables you to easily master ETF trading using technical analysis. Whether you’re a professional, full-time investor or someone who wishes to learn new techniques for actively managing his personal portfolio, you will benefit from the strategies.
In Part I, the first chapter provides you with a brief history of the growth of ETFs, which has made my strategies possible, as well as my thoughts on some of the advantages of investing and trading in ETFs instead of individual stocks. Chapter 2 describes the numerous fund families from which you can choose ETF products, as well as the unique types of ETFs that began coming to market around 2005. In addition to the popular ETFs composed simply of individual stocks, ETF offerings on the market now include currency, commodity, fixed-income, inversely correlated “short ETFs,” leveraged ETFs, and even ETFs that are both inversely correlated and leveraged. There are also ETNs (exchange-traded notes), which are structured as financial instruments, similar to bonds but possessing credit risk.
In Part II, I dive into the “meat and potatoes of the strategy by showing you specifically how technical analysis is used to trade ETFs. Chapter 3 details my top-down strategy of ETF trading, which always improves your odds of success by identifying the overall trend of the broad market, determining which sector indexes are showing the most relative strength compared to the overall stock market, and then selecting the specific ETF family with the most relative strength compared to the corresponding sector index. Chapter 4 details the method of finding the sector indexes with the most relative strength. Chapter 5 drills down to the specific ETF families with the most relative strength, and Chapter 6 provides supplemental technical indicators and chart patterns.
After learning how to select the best ETFs for trading and investing, the next step is figuring out the proper timing for entries and exits into those positions. This is covered extensively in Part III. Chapter 7 provides strategies for determining ideal entry points, and Chapter 8 shows you when to exit your positions. Chapters 9 and 10 put it all together by graphically walking you through actual trades I have made using the strategies offered in the first eight chapters. The actual outcome of the trades, using real capital, is also presented. Chapter 9 discusses 10 actual ETFs I bought long. Chapter 10 discusses 10 ETFs I sold short. Many nuances of the entire technical analysis strategy can be gleaned from these two chapters, as they are real-life situations, not merely the theory behind the strategy.
In Part IV, I provide you with a host of pointers to help fine-tune your strategy after you put it into action. Topics such as position sizing, getting efficient ETF executions, and identifying relative strength intraday are all covered in Chapter 11. Chapter 12 provides some final thoughts and pointers to “take along with you.” I encourage you to take your time reading the material, unlike a novel you might breeze through, so that you can fully digest the concepts presented. You may realize the greatest benefit through first reading the book cover to cover, and then going back and reviewing the more detailed sections to ensure you have a thorough understanding of the key points.
History and Growth of ETFs
Although you probably already have a basic understanding of ETFs, it’s important to understand just how many options you have when selecting potential ETF trades. The astonishing growth both in the quantity and types of ETFs may surprise you.
An exchange-traded fund is a basket of stocks that trades on an exchange with the same simplicity and liquidity of an individual stock. Traders and investors can buy or sell shares in the collective performance of an entire stock, bond, commodity, or even currency portfolio by buying or selling a single security. ETFs add the flexibility, ease, volatility, and liquidity of stock trading to the benefits of traditional index-fund investing. The American Stock Exchange (Amex) launched the first U.S.-based ETF in 1993 as a simple way for more aggressive retail investors to buy the entire realm of stocks that made up the Standard & Poor’s 500 Index. Trading under the ticker symbol SPY, the Standard and Poor’s Depositary Receipt (SPDR) was born. The Amex devised the ETF because it wanted to attract stock market investors who had become more interested in trading and investing in individual stocks than mutual funds. Although many investors enjoyed the high rates of return that individual stocks provided throughout the 1990s, many people still preferred the perceived “safety” that traditional mutual funds offered. Hence, the ETF was introduced as a way for investors to combine the potentially high returns of individual stock trading with the benefits of diversification that mutual funds provided.
In February 1994, one year after its official launch, SPY was trading an average daily volume of only 250,000 shares. Its popularity quickly spread, and the average daily volume of SPY increased more than 12 times to over 3 million shares per day by the beginning of 1998, five years after its launch. Although such a large initial increase in volume may seem impressive, it was only the beginning for the popularity of SPY. The absolute lows of last decade’s equity bear market, which were set in October 2002, marked the largest percentage increase in the average daily volume of SPY. In October 2002, the 50-day average daily volume of SPY was 48 million shares per day. By mid-2007, SPY was already clocking in at more than 200 million shares trading hands on an average day. That represented an astronomical increase in daily trading activity of approximately 80,000 percent in 13 years.
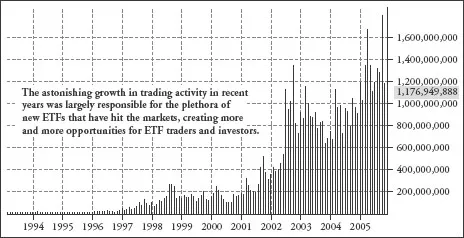
The bear market of 2000 to 2002 was partially responsible for generating interest in SPY and other ETFs as investors grew tired of attempting to pick individual winning stocks during such adverse conditions and found it easier to simply choose an ETF that suited their goals. SPY and other major ETFs have seen a remarkable increase in turnover, which began accelerating parabolically in the years 2000 through 2006. To grasp the astonishing growth of the first domestic ETF, look at the volume bars on the monthly chart of SPY in Figure 1.1.
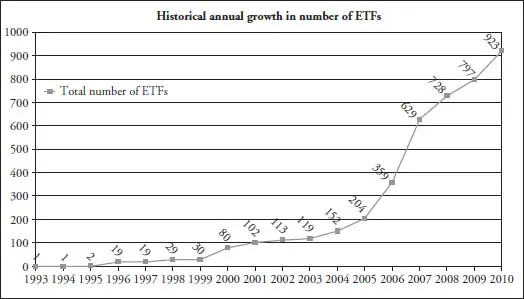
Thanks to SPY, the concept of having transparent exposure to an entire broad-based index through the simplicity of buying an individual stock caught on quickly. This popularity rapidly spurred demand for the launch of more diverse ETF offerings. A second domestic ETF was launched in 1995, and the rest is history. By 2003, just 10 years after the introduction of SPY, the number of domestic ETF offerings had grown to 119. Four short years later, by 2007, the number of ETFs traded on the U.S. exchanges had increased fivefold to more than 600. As of the end of 2010, the number of ETFs had swollen to nearly 1,000. Now, as of July 2011, there are more than 1,000 ETFs. Figure 1.2 shows how rapidly the total number of ETFs has multiplied since SPY was launched in 1993.
But it’s not only the number of ETFs that has increased dramatically: The total asset growth of ETFs has been equally impressive. Figure 1.3 illustrates the total combined asset growth of ETFs since 1993.