![]()
Chapter 1
Foreign Exchange Basics
I start with some basic knowledge about foreign exchange that the reader will want to have before tackling currency options.
THE FOREIGN EXCHANGE MARKET
An exchange rate is a market price at which one currency can be exchanged for another. Exchange rates are sometimes called pairs because there are always two currencies involved. If the exchange rate for Japanese yen in terms of U.S. dollars is 90.00, it is meant that yen can be traded for dollars—or dollars traded for yen—at the rate of $1 for 90.00 yen.
A spot foreign exchange transaction (or deal)1 is an agreement to exchange sums of currencies, usually in two bank business days' time. This transaction is the core of the foreign exchange market. A forward transaction is a deal done for settlement, or value, at a time beyond spot value day. There are two kinds of forwards. Forward outrights are similar to spot deals. The exchange rate is agreed when the deal is done on the trade date, but currencies settle at times in the future further out on the settlement calendar, say in a week, or a month, or in many months. A forward swap is the combination of a spot deal and a forward deal done in opposite directions. Forward outrights and forward swaps will be covered in detail later in this chapter.
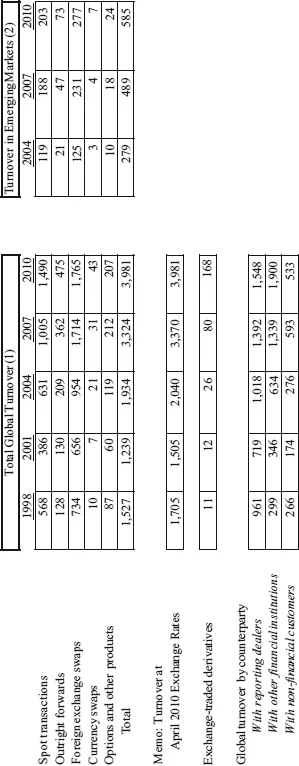
It is well known that the foreign exchange market is a very large market, but exactly how large is hard to say. Our single best source as to the size and structure of the worldwide foreign exchange market is an extensive survey of trading done by the Bank for International Settlements (BIS) in conjunction with the central banks of 50 or so nations.2 The most recent survey, published in 2010 (BIS 2010), documented the virtual explosion in foreign exchange trading since the previous surveys done in 2007, 2004, and 2001. After adjustments for double counting,3 $4 trillion of foreign exchange changed hands per day in April 2010 compared to $3.3 trillion, $1.9 trillion, and $1.2 trillion in April of 2007, 2004, and 2001, respectively. These statistics cover transactions in spot, forward outright, forward swaps, currency swaps, and options (Exhibit 1.1).4 There are at least two other recent central-bank-sponsored surveys covering specific segments of the foreign exchange market, both dating from October 2009. A Bank of England survey5 of the London market (BOE 2009) estimated $1,430 billion in total daily turnover (including spot, outright forwards, non-deliverable forwards, and foreign exchange swaps). A Federal Reserve Bank of New York (NYFED 2009) survey6 of the New York market estimated $679 billion of trading the same instruments.
Foreign exchange trading is done practically everywhere there is a banking center. According to the BIS 2010 survey, the largest centers by share of total world turnover were the United Kingdom (37 percent), the United States (18 percent), Japan (6 percent), Singapore (5 percent), Switzerland (5 percent), Hong Kong (5 percent), and Australia (4 percent). Not to be forgotten are the emerging markets nations where recently published data (BIS; Mihaljek and Packer 2010) (Exhibit 1.1) show to be rapidly expanding centers for foreign exchange trading.
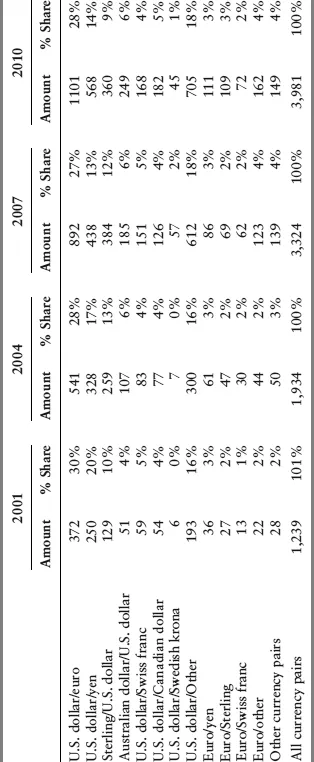
There are well more than 100 currencies. As a general rule practically every country has its own currency7 (with the European countries in the euro zone being a prominent, but not unique, exception). Yet trading in the foreign exchange market is remarkably concentrated in a handful of exchange rates (Exhibit 1.2). What is noteworthy is that the sum of trading in the dollar against the euro, yen, and sterling (in order of volume) made up 51 percent of all foreign exchange trading in 2010. In one sense, the foreign exchange market is largely the price of the dollar, inasmuch as in 2010 the dollar was on one side of 84.9 percent of all trades8,9 (followed by the euro (39.1 percent), the yen (19.0 percent), sterling (12.9 percent), and the Australian dollar (7.6 percent).10 But even a currency with a small share of total turnover can have a large volume of trading because the overall size of the market is enormous.
Exhibit 1.2 Reported Foreign Exchange Market Turnover by Currency Pair (Daily Averages in April, in Billions of U.S. Dollars and Percent)
Foreign exchange dealing has become steadily more concentrated among a handful of powerful dealing banks. Indeed, according to the BIS, the top five dealers captured more than 55 percent of the market by 2009, up from a little more than 25 percent in 1999 (see Gallardo and Heath 2009).11 At the same time that trading in foreign exchange has been growing, the number of banks doing large-scale foreign exchange trading has been shrinking. Roughly speaking, the number of money center banks that account for 75 percent of foreign exchange turnover has roughly dropped by two-thirds in the period between 1998 and 2010 (BIS 2010). On a geographic basis, the number of such banks shrunk from 24 to 9 in the U.K., from 20 to 7 in the United States, from 7 to 2 in Switzerland, from 19 to 8 in Japan, and from 23 to 10 in Singapore during this decade. This is probably best seen as an outcome of the general trend of consolidation in the financial services industry. In the meantime the development of electronic trading has materially altered the nature of the foreign exchange market. The lower section of Exhibit 1.1 shows global foreign exchange turnover by counterparty to the reporting banks. Note that the historical pattern is for dealing banks (i.e., “reporting” in the language of the BIS surveys) to trade primarily with other dealing banks. That pattern began to change as early as 2001. An explanation is that electronic trading has resulted in dealing banks now trading less with other dealing banks and more with other financial institutions that are not themselves dealing banks. The 2010 survey is the first time that the volume of trading between dealers and nondealers was reported to have been greater in volume than trading within the dealer community. The BIS category of nonreporting financial institutions includes smaller banks, mutual funds, money market funds, insurance companies, pension funds, hedge funds, currency funds, and central banks, among others.12 The magnitude of this shift is remarkable when one considers that 85 percent of the increase in the global turnover in foreign exchange originated from dealers trading with this category of other financial institutions.
THE INTERNATIONAL MONETARY SYSTEM
Bretton Woods and the Smithsonian Period
For the first quarter century after the Second World War, the international monetary system consisted of a program of fixed exchange rates. Fixed exchange rates were established under the Bretton Woods agreement signed by the Allied powers in 1944 in advance of the end of the Second World War. The Bretton Woods agreement required all member central banks to keep their foreign exchange reserves in U.S. dollars, pounds Sterling, or gold. More importantly, member countries agreed to stabilize their currencies within a 1 percent band around a target rate of exchange to the U.S. dollar. The dollar, in turn, was pegged to gold bullion at $35 per ounce. Parts of the system lasted until 1971.
Periodically, currencies had to be revalued and devalued when market pressures became too great for central banks to oppose. Cynics dubbed the Bretton Woods a “system of creeping pegs.” In 1971, after a series of dramatic “dollar crises,” the dollar was devalued against gold to $38 an ounce,13 and a wider bandwidth, equal to 2.25 percent, was established. This modification to the system, called the Smithsonian Agreement, postponed the collapse of the system of fixed exchange rates for two years. In 1973, President Richard Nixon scrapped the entire structure of fixed exchange rates that had begun with Bretton Woods. Since that time, exchange rates for the major currencies against the dollar have been floating.
The Euro
On January 1, 1999, 11 European nation members of the European Monetary Union, Austria, Belgium, Finland, France, Germany, Ireland, Italy, Luxembourg, Netherlands, Portugal, and Spain, adopted a new common currency, called the euro. The legacy currencies of these eleven nations, such as the German mark and French franc, circulated in parallel to the euro for a time but were exchangeable to the euro at fixed exchange rates. Total conversion to the euro happened on January 1, 2002, at which time the European Central Bank issued euro notes and coins. Additional countries have joined the euro since that time: Greece in 2001, Slovenia in 2007, Cyprus and Malta in 2008, Slovakia in 2009, and Estonia in 2011. At the current time 17 countries have adopted the euro. Noteworthy by their absence are the United Kingdom and Denmark. Switzerland is not part of the European Monetary Union.
The road to the creation of the euro was difficult. For nearly two decades, starting with the creation of the European Monetary System in March 1979, parts of Europe experimented with a fixed exchange rate system that was known as the Exchange Rate Mechanism (ERM). Under the ERM, member countries agreed to peg their currencies to a basket currency called the European Currency Unit (ECU). Currencies were allowed to move in relation to the ECU within either the narrow band of plus...