Veterinary Echocardiography, Second Edition is a fully revised version of the classic reference for ultrasound of the heart, covering two-dimensional, M-mode, and Doppler examinations for both small and large animal domestic species. Written by a leading authority in veterinary echocardiography, the book offers detailed guidelines for obtaining and interpreting diagnostic echocardiograms in domestic species. Now thoroughly updated to address advances in technology, including better transducers, tissue harmonic imaging, better color flow mapping, and color and spectral tissue Doppler imaging, this second edition provides an authoritative, comprehensive resource for echocardiographers of all levels of experience.
The Second Edition has been restructured to be more user-friendly, with chapters on acquired and congenital heart diseases broken down into shorter disease-specific chapters. Key changes include the addition of normal tissue Doppler technique, as well as five new appendices, covering topics such as normal reference ranges and an exam checklist. Veterinary Echocardiography, Second Edition builds on the success of the previous edition to provide complete information on obtaining echocardiograms in veterinary medicine.
Trusted by 375,005 students
Access to over 1.5 million titles for a fair monthly price.
Cardiac ultrasound, echocardiography, permits noninvasive and nonionizing visualization of the inside of the heart including the aorta, the ventricles and atria, the auricular appendages, and all of the cardiac valves. Dynamic images of the contracting heart are created with two-dimensional and motion mode (M-mode) images while blood flow through the heart can be seen and measured with Doppler ultrasound. Tissue Doppler imaging allows analysis of myocardial motion. Defects including valvular lesions, cardiac shunts, cardiac and thoracic masses, pleural and pericardial effusions, myocardial diseases, and stenotic lesions can be seen. More importantly it allows assessment of cardiac chamber sizes, cardiac function, blood flow, and myocardial motion, which provides information on hemodynamic status and extent of the disease process.
Uses of Echocardiography
See internal cardiac structures.
Evaluate function.
Evaluate size.
See defects.
Valvular lesions
Shunts
Myocardial abnormalities
Masses
Effusions
Stenotic lesions
Evaluate blood flow.
Assess myocardial motion and function.
All of this is possible because of sound. Sound is sent into the body and reflected from soft tissue structures. The reflected sound waves are analyzed, and an image is generated on a monitor. Sending out many sound waves side by side will produce an image with depth and width. The result is a two-dimensional image (Figure 1.1). When the sound waves are continuously and rapidly sent out in sequence, many two-dimensional images can be generated per minute, and a moving image of the heart is made called real-time or B-mode ultrasound. By sending out only one sound beam instead of many, only the structures associated with that one beam are seen, producing an M-mode image (Figure 1.2). The structures associated with that one line through the heart keep scrolling on the screen as the heart continues to contract and relax. The M-mode image displays depth on the vertical axis and time along the horizontal axis.
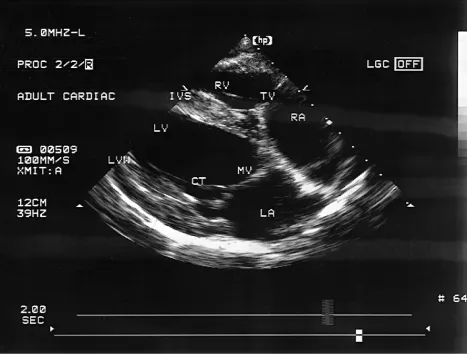
Figure 1.1 Many sound waves sent into the body side by side will create an image with depth and width. The result is a two-dimensional echocardiographic image. This is a right parasternal long-axis four-chamber view of the heart. RV = right ventricle, TV = tricuspid valve, RA = right atrium, IVS = interventricular septum, LV = left ventricle, LVW = left ventricular wall, LA = left atrium, MV = mitral valve, CT = chordae tendineae.
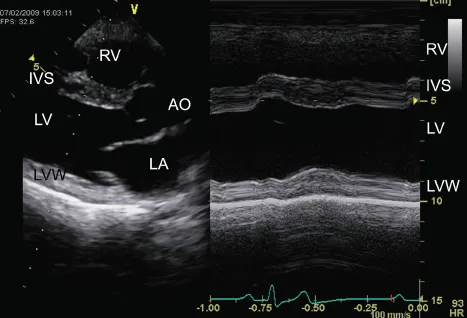
Figure 1.2 When one of the sound beams used to create the two-dimensional image is selected to generate an M-mode image, only the structures associated with that one beam are seen. The two-dimensional image at the left side of this figure shows a cursor representing the one beam. A one-dimensional M-mode image is created from the structures the cursor crosses. The vertical axis represents depth while the horizontal axis represents time. Here the structures of the left ventricle are seen on the M-mode to the right as they change throughout a cardiac cycle. RV = right ventricle, IVS = interventricular septum, LV = left ventricle, LVW = left ventricular wall, AO = aorta, LA = left atrium.
Doppler is used in diagnostic ultrasound to provide information on blood flow (spectral and color-flow Doppler) or myocardial motion (tissue Doppler imaging [TDI]) of the heart and its vessels. Specific locations within the heart can be selected and a spectral display of blood flow or muscle motion is created. As in M-mode the horizontal axis represents time while the vertical axis represents velocity (Figure 1.3).
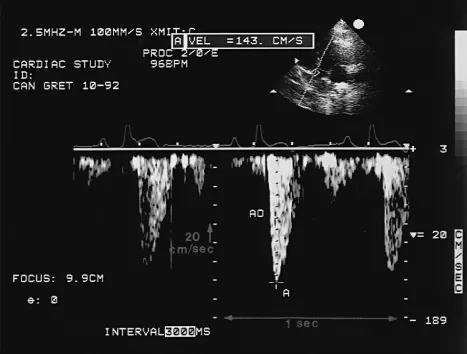
Figure 1.3 Doppler images display flow velocities on the vertical axis and time on the horizontal axis. Blood flow for specified areas in the heart is seen as it accelerates, reaches a maximum velocity, and then decelerates throughout the cardiac cycle. This CW Doppler tracing of aortic flow (AO) in a dog has a velocity of 143 cm/sec (A).
This chapter deals with the physical principles of sound waves that allow ultrasound to be used as a diagnostic tool. The physics of ultrasound involves an understanding of the basic properties of sound waves and how these properties affect transducer selection, image quality, and diagnostic interpretation. Only the principles needed to make knowledgeable technical decisions and diagnostic interpretations are presented in this chapter. More detailed information can be found in books dedicated to the physics of diagnostic ultrasound. Selected references are listed at the end of the chapter.
Basic Physics
Cycles and Wavelengths
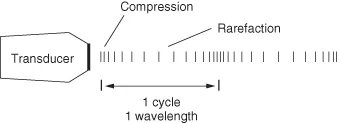
Sound waves travel in longitudinal lines within a medium. The molecules along that longitudinal course of movement are alternately compressed (molecules move closer together) and rarefacted (molecules are spread apart). The time required for one complete compression and rarefaction to occur is one cycle (Figure 1.4). The distance in millimeters that the sound wave travels during one cycle is its wavelength.
Sound Waves
Alternately compress and spread apart the molecules in their pathway.
1 cycle = one complete compression and expansion
Wavelength = the distance traveled during 1 cycle
Figure 1.4 Sound waves cause compression and rarefaction of the molecules along their path. The time for one complete compression and rarefaction to occur is called a cycle. The distance sound travels during one cycle is measured in millimeters and is its wavelength.
The source of the sound wave determines the length of a cycle. Transducers generate the sound in diagnostic ultrasound. They will be discussed in detail later, but for any given transducer the wavelength is constant.
Frequency
The number of cycles per second is the frequency of the sound wave (Figure 1.5). Frequency is measured in Hertz (Hz), where 1 Hz equals one cycle per second. Ultrasound has a frequency greater than 20,000 cycles per second, and is beyond the range of human hearing. Since frequency is the number of complete cycles per second, the higher the frequency of the sound wave the shorter the wavelength must be.
Frequency
The number of cycles per second = frequency
High frequency = shorter wavelengths
Low frequency = longer wavelengths
Figure 1.5 The number of cycles per second is the frequency of the sound wave. Frequency is measured in Hertz (Hz). One Hz equals one cycle per second.
A 5.0-megahertz (MHz) transducer transmits 5 million cycles per second at 0.31 millimeters (mm) per cycle, while a 2.0-MHz transducer transmits only 2 million cycles per second at 0.77 mm per cycle. Table 1.1 lists wavelengths for sound generated at various frequencies.
Table 1.1 Wavelength of Sound at Commonly Used Frequencies
Frequency (MHz)
Wavelength (mm)
2.0
.77
3.5
.44
5.0
.31
7.5
.21
Speed of Sound
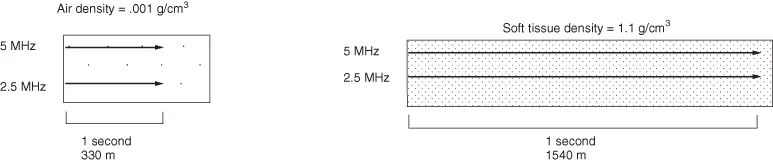
The speed of sound (V) depends upon the density and stiffness of the medium through which it is traveling. Increased density allows sound to travel faster. The velocity of sound does not change within a homogeneous substance and is independent of frequency (Figure 1.6). Table 1.2 lists the speed of sound in various tissues. The speed of sound through air is very slow because of its low density, while bone allows sound to travel at relatively high speeds.
Table 1.2 The Speed of Sound in Soft Tissues
Tissue
Speed(m/sec)
air
330
fat
1,440
brain
1,510
liver
1,560
kidney
1,560
muscle
1,570
blood
1,570
bone
4,080
Figure 1.6 Increased tissue density allows sound to travel faster. Sound generated by a 2.5-MHz transducer and a 5.0-MHz transducer will have the same velocity within the same tissues since the speed of sound is not affected by frequency.
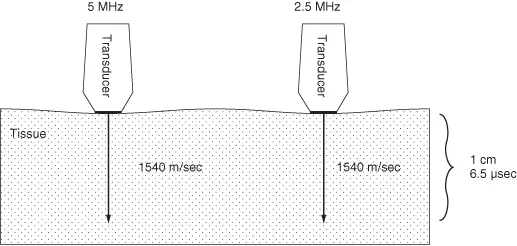
The average velocity of a sound wave in soft tissue is 1,540 meters per second regardless of transducer frequency (Figure 1.7). Velocity is calibrated into the ultrasound machine, which then calculates the distance (D) to cardiac structures based upon how long it takes to receive reflected echoes (T):
Equation 1.1
Transducer frequency does not affect the speed of sound in tissues.
Figure 1.7 Sound travels through soft tissues at an average velocity of 1,540 m/sec regardless of transducer frequency. The time required to travel 1 cm at 1,540 m/sec is 6.5 microseconds (µsec) one way and 13 µsec round trip.
The time (T) required to travel 1 cm is 6.5 micr...
Table of contents
Cover
Half title page
Title page
Copyright page
Dedication
Preface
Acknowledgments
CHAPTER ONE The Physics of Ultrasound
CHAPTER TWO The Two-Dimensional Echocardiographic Exam
CHAPTER THREE The M-Mode and Doppler Examination
CHAPTER FOUR Evaluation of Size, Function, and Hemodynamics
CHAPTER FIVE Acquired Valvular Disease
CHAPTER SIX Hypertensive Heart Disease
CHAPTER SEVEN Myocardial Diseases
CHAPTER EIGHT Pericardial Disease, Effusions, and Masses
CHAPTER NINE Congenital Shunts and AV Valve Dysplasia
CHAPTER TEN Stenotic Lesions
APPENDIX ONE Bovine
APPENDIX TWO Canine
APPENDIX THREE Equine
APPENDIX FOUR Feline
APPENDIX FIVE Miscellaneous Species
Index
Frequently asked questions
Yes, you can cancel anytime from the Subscription tab in your account settings on the Perlego website. Your subscription will stay active until the end of your current billing period. Learn how to cancel your subscription
No, books cannot be downloaded as external files, such as PDFs, for use outside of Perlego. However, you can download books within the Perlego app for offline reading on mobile or tablet. Learn how to download books offline
We are an online textbook subscription service, where you can get access to an entire online library for less than the price of a single book per month. With over 1.5 million books across 990+ topics, we’ve got you covered! Learn about our mission
Look out for the read-aloud symbol on your next book to see if you can listen to it. The read-aloud tool reads text aloud for you, highlighting the text as it is being read. You can pause it, speed it up and slow it down. Learn more about Read Aloud
Yes! You can use the Perlego app on both iOS and Android devices to read anytime, anywhere — even offline. Perfect for commutes or when you’re on the go. Please note we cannot support devices running on iOS 13 and Android 7 or earlier. Learn more about using the app
Yes, you can access Veterinary Echocardiography by June A. Boon in PDF and/or ePUB format, as well as other popular books in Medicine & Veterinary Medicine. We have over 1.5 million books available in our catalogue for you to explore.