Designed specifically for clinicians new to device therapy, The Nuts and Bolts of Interpreting Paced ECGs and EGMs offers practical, reliable and objective information on paced cardiac electrograms. Written in a lively, intelligent and easy to navigate style, emphasizing real-life clinical practice and practical tips, this book includes illustrated paced ECGs by skilled artists to help minimize "fuzzy" lines and emphasize key points. Each chapter concludes with a checklist of key points from each subject ("Nuts and Bolts").
- English
- ePUB (mobile friendly)
- Available on iOS & Android
eBook - ePub
The Nuts and bolts of Paced ECG Interpretation
About this book
Nothing is more perplexing to the clinician new to device therapy than having to deal with cardiac electrocardiograms from a device patient. Pacemakers and other implantable cardiac rhythm management devices leave their "imprint" on ECGs and can significantly change what clinicians see - or expect to see. Evaluating paced ECGs can be challenging, yet nowhere is it taught in any sort of comprehensive manner.
Trusted by 375,005 students
Access to over 1.5 million titles for a fair monthly price.
Study more efficiently using our study tools.
Information
PART I
TIMING CYCLES AND TROUBLESHOOTING REVIEW
SECTION 1
CALCULATING RATES AND INTERVALS
Figure 1.1
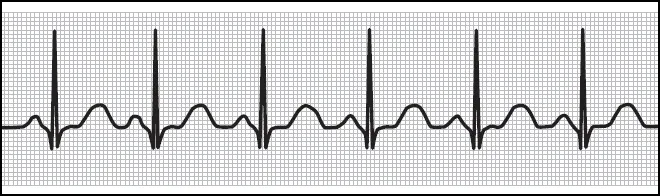
Few clinicians can escape their training without having to learn to read a basic ECG. The illustration above is a textbook-type ECG, a perfect example of an ECG that you would probably never see in real-life clinical practice. That’s fine, since you should learn from textbooks and then apply your knowledge to the messier ECGs you’ll come up with in the clinic.
A surface ECG is a graphic representation of electrical energy. The electricity that generates this tracing is obtained from the surface of the skin of the patient. It’s amazing that the heart (about the size of a clenched fist) can generate enough electricity so that it can be picked up on the skin.
The smallest rounded bumps on the ECG are the P-waves, which graphically depict the atrial depolarization. This is followed closely by the largest waveform on the ECG, a pointed wave that goes both below and above the baseline. Called the QRS complex (also sometimes nicknamed an R-wave), this sharp, pointed waveform depicts the depolarization of the ventricles. It’s much larger on the tracing because the ventricles are much larger than the atria and produce more electricity as they squeeze together to pump out blood. After a short pause is another rounded waveform known as the T-wave. The T-wave represents the ventricular repolarization, that is, the time period where the ventricles go back to baseline, in other words, from depolarization to repolarization.
Standard ECG paper has a grid on it that can help you “eyeball” timing. The gridwork is made up of many tiny blocks that are 1 mm square. Each of these tiny boxes is 40 ms duration. Heavier lines are used to make larger squares of five boxes tall and five boxes wide. Each larger square has a duration of 200 ms. Five of these larger squares (200 × 5) equals 1000 ms or 1 sec.
By counting out the grids, you can get a fast approximation of the duration of a particular cardiac cycle or timing cycle. This is going to become increasingly important as we get into paced ECGs. With the heart, timing is everything!
TEST YOUR KNOWLEDGE
1 Looking at this non-paced ECG, would you say that this patient has a regular or an irregular rhythm?
2 Using just this tracing, approximate how long (in ms) the duration is from one P-wave to the next P-wave.
Figure 1.2
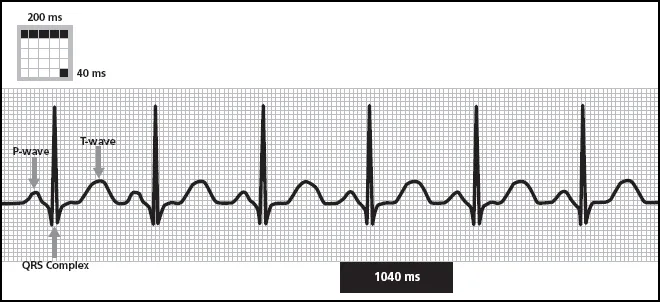
This rhythm is regular. Once your eye gets trained to reading ECGs, it is easy to look at a rhythm and appreciate something that is regular or irregular. What makes this rhythm regular, however, is not that the QRS amplitudes are the same or the T-waves have the same morphology (shape). (Those things matter, but for different reasons that we’ll get into later on.) The regularity of this rhythm refers to its even timing. Notice that the complexes all have the same duration. It doesn’t matter whether you measure from P-wave to P-wave, R-wave to R-wave, or T-wave to T-wave, you’ll see the same results. In fact, if you go to the very last complex on the strip, and then added some blank grid paper, you would know enough to draw in where the next P-wave and QRS complex would fall.
In this tracing, we can see that the distance between one P-wave and the next consecutive P-wave is about 1040 ms. That’s based on 4 big squares (4 × 200 = 800) plus 6 little boxes (6 × 40 = 240). You could also measure QRS to QRS or any other complexes. The trick is to measure from the one waveform to the next consecutive waveform of that type.
When clinicians talk about heart rate, we generally use terms like “70 beats per minute” or “82 bpm” or we might say a patient’s heart rate is 120/min. In fact, pacemakers almost always program rate in terms of pulses per minute (ppm) even though this information is not obvious on the ECG. While we humans tend to prefer beats per minute as a way to express rate, pacemakers (and ECG machines) use durations or intervals. That is, this strip does tell us the rate in the form of an interval value (1040 ms). But what rate is that?
Clinicians who work with pacemakers have to be able to convert intervals to rates and vice versa. There are conversion tables that do this and many pacemaker programmers will assist you as well. However, it can also be done with some basic arithmetic or a simple calculator. If one cardiac cycle (i.e., one beat) took 1040 ms, how many beats would occur in a minute? First, we know that 1 minute = 60 seconds or 60,000 ms (60 × 1000). By dividing 1040 (the interval duration) into 60,000 ms (1 minute), you arrive at the rate (57.69 beats a minute, which you would probably state as 58 bpm).
The formula works backward, too. For instance, if you know that a patient’s heart rate is right around 80 bpm, you could expect to see a cardiac cycle interval duration on the ECG of about 750 ms (80 divided by 60,000). That’s three big boxes on the ECG paper and almost four little boxes (3 × 200 = 600 and 4 × 40 = 160).
The nuts and bolts of rates and intervals
- A regular rhythm refers to the timing of the events on the ECG (not necessarily the consistency of waveform shapes).
- Grid paper on an ECG can help you rapidly approximate intervals. Each tiny box is worth 40 ms, the heavier-lined squares count as 200 ms.
- When calculating the interval of a cardiac cycle, measure from one type of event (P-wave or QRS complex or T-wave) to the next consecutive such event.
- Devices tend to “think” in intervals, people tend to think in rates, but they are really just two different ways of expressing the same thing. Convert rate to interval by dividing 60,000 by the rate; convert interval to rate by dividing 60,000 by the interval. For example, 60 ppm converts to a pacing interval of 1000 ms.
SECTION 2
PACING SPIKES
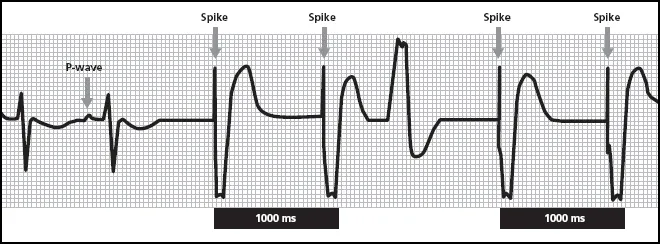
Figure 2.1
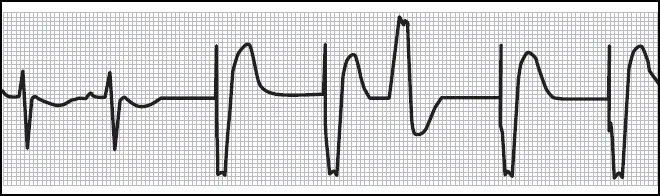
This is a paced ECG. You can immediately see it starts to look quite different than a non-paced ECG! The large vertical lines on the strip are pacemaker “spikes,” sometimes called pacing artifacts. This is an electrical signal left on the ECG from the pacemaker output pulse. The output pulse leaves a straight line rather than a more filled out space because a pacemaker output pulse has a very short duration. On average, pacemaker output pulses are about 0.4 ms (that’s less than one thousandth of one second)! That sort of ultra-short but strong energy will just make a line on the tracing rather than a curved or even pointed shape.
These output pulses are quite large. A pacing expert might look at this tracing and tell you the pacemaker was “unipolar.” You’ll also encounter pacemaker spikes that are much shorter (bipolar systems). There can be other reasons for prominent pacing spikes or less visible ones. For instance, the gain control on the ECG monitor may affect the size of the pacing artifact. As a rule of thumb, unipolar pacing involves larger, more visible spikes compared to bipolar pacing. However, new ECG equipment can help adjust the spikes so that unipolar and bipolar spikes appear equivalent.
Unipolar and bipolar are pacing terms that are actually a little bit misleading. They refer to the electrical circuit formed when the pacemaker emits an output pulse. All electricity travels in a circuit, and all circuits have two poles (an anode or positive pole and a cathode or negative pole). A unipolar pacemaker has a lead that forms its electrical circuit using the electrode on the lead itself and the pacemaker can. A bipolar system has a lead with two electrodes that forms a circuit. Thus, the terms “unipolar” and “bipolar” really refer to how many poles are in use on the lead. A unipolar pacemaker has electricity that travels over a wider area than a bipolar pacemaker. As a result, you can expect unipolar pacemakers to show larger pacing spikes than bipolar pacemakers.
The first two QRS complexes on this strip are non-paced. The pacemaker spike appears before the QRS complex in the rest of the complexes. Note that the pacing spike changes the morphology or shape of the QRS complex. This occurs to varying degrees by patient and by the lead observed, but a clinician can often “see” the difference between a paced ventricular depolarization and an intrinsic ventricular depolarization.
There is also an odd-looking event in the middle of the strip. It’s an upward deflection with notches.
TEST YOUR KNOWLEDGE
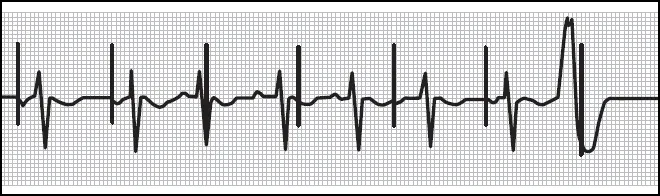
Figure 2.2
1 Can you see atrial activity on this rhythm strip? Is there atrial pacing going on?
2 How many pacing spikes do you see on this strip? Which chamber of the heart is being paced?
3 Using the grid, approximately how long is the interval between the last pacemaker spike and the one before it?
4 Is that the same as the interval between the first pacemaker spike and the one immediately following it? What rate would this be?
5 What is that odd-looking event in the middle of the strip?
Atrial activity does show up on this ECG but it is not consistent. An imperfect atrial rhythm is nothing unusual, since patients with pacemakers have serious cardiac rhythm problems! The P-wave indicated in the illustration marks an intrinsic atrial depolarization, that is, there is no pacemaker spike to show that a pacemaker output pulse was in any way associated with that atrial event.
There are four pacemaker spikes on this strip. They are large spikes and they show up in association with ventricular events. You can also see that the paced ventricular beats look noticeably different than the intrinsic ventricular events that appear at the beginning of this strip. If you get ECGs with lots of paced and non-paced ventricular activity, it is often possible to use morphology alone to distinguish paced from intrinsic beats.
Looking at the first ventricular spike and the one immediately following it and the last ventricular spike and the one immediately preceding it, the grid work gives us an approximate interval duration of 1000 ms (5 large squares × 200 ms). Converting 1000 ms to a rate is the easiest of all of the interval values: 1000 ms equals 60 beats per minute. The intervals between the two sets of pacing spikes we measured are the same, which shows a nice, consistent pacing rate. (In the clinic, you should check this against how the device was programmed. For this particular patient, expect to see a ventricular pacing rate of 60 ppm.)
In the middle of this strip, there is an odd-looking upward deflection. It looks a lot like a paced ventricular event, but it has a different morphology (shape) and there is a noticeable absence of pacemaker spike. Since this depolarization is not paced, it has to be intrinsic. It appears that about 600 ms (3 large squares × 200 ms) after the previous ventricular output pulse, the ventricles contracted on their own. This is a premature ventricular contraction or PVC. They are not uncommon to see in clinical practice, and they show up on paced ECGs just like non-paced ECGs.
The question with the PVC is this: what does the pacemaker do with it? All pacemakers do only two things: they sense and they pace. We see evidence of ventricular pacing in this strip. Here, with the PVC, we also have good evidence of ventricular sensing. If you try to calculate the interval from the previous pacemaker spike to the PVC, you’ll see that it is much shorter than 1000 ms. That’s because this was a PVC, that is, it occurred much earlier in the cardiac timing cycle. However, once the PVC occurred, the pacemaker should have “sensed” it and used it to reset the pacemaker timing. That is, the distance between the PVC and the next ventricular output pulse should be 1000 ms.
If you measure from the initial upward deflection of the PVC to the next pacemaker spike, you will get five large squares or 1000 ms. This means the pacemaker sensed the PVC, counted it as an intrinsic ventricular event (which it was) and then timed its next pacemaker output to occur 1000 ms later. That is good evidence of appropriate ventricular sensing.
When a pacemaker senses intrinsic cardiac activity that occurs in certain time periods (called “alert periods”), the pacemaker counts the event and uses it as a “landmark” on which to base future timing. In this case, the intrinsic ventricular event (premature ventricular contraction or PVC) caused the pacemaker to withhold a pacemaker output until 1000 ms after the PVC. Had the PVC not occurred, the next pacemaker spike would have occurred much earlier, that is, 1000 ms after the previous spike. The ability of the pacemaker to withhold pacing when events are sensed is known as “inhibition.” Here, a PVC occurred which inhibited the ventricular output until the appropriate interval timing could be restored.
The nuts and bolts of pacing spikes
- Pacemaker output pulses appear on the ECG as spikes, vertical lines. They can be large or small, depending on the pacemaker system and ECG equipment but will be consistent within the strip.
- Unipolar devices tend to leave larger spikes on the ECG than bipolar systems. Both unipolar and bipolar devices provide excellent pacing reliability. The difference is the size of the electrical “antenna.” A unipolar device delivers an output pulse that makes a larger circuit through the body than a bipolar device.
- Unipolar and bipolar in pacing are actually misnomers. All electrical circuits have two poles! A unipolar device has one pole on the lead, a bipolar device has two poles on the lead.
- When pacing at the programmed base rate, you should see spikes appear at precisely timed and consistent intervals. However, if intrinsic events occur between paced events, it can reset the timing.
- Pacemakers can only do two things: sense and pace. One evidence for pacing is the tell-tale spike. You cannot “see” sensing as obviously, but you can measure it. When an intrinsic event resets timing, that is good evidence that it has been seen or sensed by the pacemaker.
- Inhibition occurs when a pacemaker withholds (“inhibits”) an output pulse because of intrinsic cardiac activity.
- Paced QRS complexes tend to have a different morphology than intrinsic QRS complexes. Paced ventricular beats tend to be wider and might have a notch. This is not always the case, but is common.
- Pacing at the right-ventricular (RV) apex typically causes a wider QRS complex and a QRS morphology that resembles left bundle-branch block (LBBB). Most patients with conventional pacemakers are paced from the RV apex.
- Seeing a pacemaker spike followed by a wider notched QRS complex is good evidence of ventricular capture.
SECTION 3
THE BASICS OF CAPTURE AND SENSING
Figure 3.1
This paced ECG shows atrial and ventricular activity, but notice where the pacing spikes fall. This is an ECG from a device pacing the atrium. In the very first complex, there is an atrial spike, an atrial event, and an intrinsic ventricular event. It happens again in the second complex. But now look at the third complex.
In this particular complex, the pacing spike falls right in the middle of the ventricular complex. The QRS complex is not paced; it has the same morphology as the intrinsic QRS complexes that preceded it. What’s going on? The spike occurs on the atrial channel and although it occurs at the same time as the ventricular event, it is unrelated to the intrinsic ventricular event.
The next pacing spike occurs after an intrinsic ventricular event. Then there is another “displaced” spike. In terms of what is going on in the heart, the spikes seem to just occur at random. But take a closer look! It isn’t random at all. Measure the distance between the spikes. You can eyeball it or get out the calipers. You’ll be able to count out 840 ms between spikes (4 large squares and 1 small box or 4 × 200 = 800 + 40 = 840 ms) which converts to about 71 beats a minute.
This pacing behavior is not random at all; the atrial spikes appear at precise intervals. However, they are not synchronized or working with the intrinsic activity.
This strip is an example of what we would call an asynchronous pacing mode. It’s AOO pacing. The device paces the atrium but it does not sense; in fact, is has no regard for intrinsic activity.
In clinical practice, you won’t see asynchronous pacing very much, but it can be used for testing, backup pacing, a...
Table of contents
- Cover
- Title
- Copyright
- Preface
- Before We Start …
- PART I: TIMING CYCLES AND TROUBLESHOOTING REVIEW
- PART II: WORKBOOK
- Index
Frequently asked questions
Yes, you can cancel anytime from the Subscription tab in your account settings on the Perlego website. Your subscription will stay active until the end of your current billing period. Learn how to cancel your subscription
No, books cannot be downloaded as external files, such as PDFs, for use outside of Perlego. However, you can download books within the Perlego app for offline reading on mobile or tablet. Learn how to download books offline
Perlego offers two plans: Essential and Complete
- Essential is ideal for learners and professionals who enjoy exploring a wide range of subjects. Access the Essential Library with 800,000+ trusted titles and best-sellers across business, personal growth, and the humanities. Includes unlimited reading time and Standard Read Aloud voice.
- Complete: Perfect for advanced learners and researchers needing full, unrestricted access. Unlock 1.5M+ books across hundreds of subjects, including academic and specialized titles. The Complete Plan also includes advanced features like Premium Read Aloud and Research Assistant.
We are an online textbook subscription service, where you can get access to an entire online library for less than the price of a single book per month. With over 1.5 million books across 990+ topics, we’ve got you covered! Learn about our mission
Look out for the read-aloud symbol on your next book to see if you can listen to it. The read-aloud tool reads text aloud for you, highlighting the text as it is being read. You can pause it, speed it up and slow it down. Learn more about Read Aloud
Yes! You can use the Perlego app on both iOS and Android devices to read anytime, anywhere — even offline. Perfect for commutes or when you’re on the go.
Please note we cannot support devices running on iOS 13 and Android 7 or earlier. Learn more about using the app
Please note we cannot support devices running on iOS 13 and Android 7 or earlier. Learn more about using the app
Yes, you can access The Nuts and bolts of Paced ECG Interpretation by Tom Kenny in PDF and/or ePUB format, as well as other popular books in Medicina & Fisiología. We have over 1.5 million books available in our catalogue for you to explore.