eBook - ePub
Changing Cold Environments
A Canadian Perspective
- English
- ePUB (mobile friendly)
- Available on iOS & Android
eBook - ePub
Changing Cold Environments
A Canadian Perspective
About this book
Changing Cold Environments; Implications for Global Climate Change is a comprehensive overview of the changing nature of the physical attributes of Canada's cold environments and the implications of these changes to cold environments on a global scale. The book places particular emphasis on the broader environmental science and sustainability issues that are of increasing concern to all cold regions if present global climate trends continue. Clearly structured throughout, the book focuses on those elements of Canada's cold environments that will be most affected by global climate change – namely, the tundra, sub-arctic and boreal forest regions of northern Canada, and the high mid-latitude mountains of western Canada. Implications are considered for similar environments around the world resulting in a timely text suitable for second and third year undergraduates in the environmental or earth sciences courses.
Trusted by 375,005 students
Access to over 1.5 million titles for a fair monthly price.
Study more efficiently using our study tools.
Information
Part One
Spatial and Temporal Variability of Canada's Cold Environments
Chapter 1
Cold Canada and the Changing Cryosphere
1.1 Introduction
In a series of major reports, first initiated in 1990, the United Nations Intergovernmental Panel on Climate Change (IPCC) has been assessing the nature, impact and implications of current global climate change. The latest report (IPCC, 2007) concluded that warming of the climate system is unequivocal. A global temperature increase of about 0.2 °C per decade is projected for the coming two decades. It has also become clear that the cryospheric components of the climate system are closely linked to this global warming. Moreover, Canada, along with Russia and Greenland, shares the majority of the northern cryosphere.
The general thrust of the 2007 IPCC report, namely, that the Earth's climate is changing with negative consequences, has led to publication of a counter-document by the Nongovernmental International Panel on Climate Change (NIPCC), a non-profit research and educational organization based in the USA. This report (Singer and Idso, 2009) challenges the scientific basis behind the concerns that global warming is either man-made or would have harmful effects. It is argued that twentieth century warming has been moderate and, in fact, is not unprecedented.
We do not wish to enter this global minefield; we leave that to others. Instead, the aim of this book is to simply document the changing nature of Canada's cold environments and, by implication, outline the possible global impacts. We restrict the broader discussion to the northern hemisphere.
1.2 The Cryosphere
The main components of the cryosphere are snow, river and lake ice, sea ice, glaciers and ice caps, ice shelves and ice sheets, and frozen ground (Figure 1.1). Their relevance to climate change lies in: (i) their high surface reflectivity (albedo), (ii) the fact that all three phases of water (solid, liquid and vapour) coexist over the range of the Earth's temperatures and pressures, and (iii) the large amount of latent heat associated with the phase changes between water and ice. It follows that the cryosphere has a strong impact upon the surface energy balance. The presence or absence of snow or ice at the global scale is linked to temperature differences that affect global winds and the thermohaline circulation of the oceans. The latter is initiated by the outpouring of cold arctic waters through Fram Strait in the deep channel between Greenland and the Svalbard archipelago and goes on to circulate throughout the world's oceans.
Figure 1.1 Components of the cryosphere with relevant time scales. Source: IPCC 2007, Figure 4.1., Lemke et al., 2007.
Some cryospheric components invoke positive feedback mechanisms that act to amplify change and variability. For example, a decrease in snow and sea ice extent reduces albedo and increases heat absorption. The resulting temperature increase leads to further reduction in snow and ice extent and consequently accelerated temperature rise. By contrast, other components like glaciers and permafrost act to average out short term variability and may be regarded as sensitive medium term indicators of climate change.
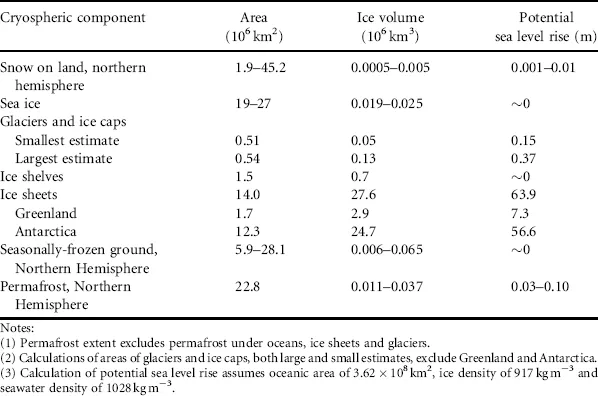
The spatial extent and global volume of the different cryospheric components are summarized in Table 1.1. Collectively, seasonally frozen ground and permafrost have the largest areal extent. As an approximation, the maximum extent of seasonally frozen ground (which includes the active layer over permafrost) is about 51% of the land area of the northern hemisphere. Snowcovers approximately 49% of the northern hemisphere land surface in mid-winter. By contrast, permanent ice in the form of glaciers and ice caps covers less than 1% of the land surface. In terms of global ice volume in the northern hemisphere, the Greenland ice sheet dominates and only a tiny fraction of ice is contained within the ice caps and glaciers of Canada, Alaska, Svalbard, Scandinavia and Russia.
Table 1.1 Area, volume and sea level equivalents of the cryospheric components.
Source: IPCC 2007, Table 4.1., Lemke et al., 2007
1.2.1 Changes in the Cryosphere
The 2007 IPCC report concluded that, since 1980, there has been a global scale decline of snow and ice, and that this decline has continued over the past decade (Figure 1.2). Satellite measurements indicate that the extent of northern hemisphere snowcover has declined by about 2% per decade since 1966 (a figure that is heavily dependent on the starting date chosen) and annual sea ice extent in the Arctic has decreased by 2.7 ± 0.6% per decade since 1978. During the same period, summer sea ice extent has decreased by 7.4 ± 2.4% per decade. There is also evidence that arctic sea ice has thinned by approximately 40% over the 1958–1977 period and in the 1990s. At the same time, field observations from many localities in the northern hemisphere suggest warming of permafrost and a decrease in its spatial extent, an increase in active layer thickness, a decrease in the depth of winter freeze in seasonally frozen areas and a decrease in duration of seasonal river and lake ice.
Figure 1.2 Departures from the long term mean of different cryospheric variables in the Northern Hemisphere since 1960. (a) Polar air temperature north of 65° N, (b) Arctic sea ice extent, (c) Northern Hemisphere frozen ground extent, (d) Northern Hemisphere snow-cover extent, (e) Global glacier mass balance. Source: FAQ 4.1., Lemke et al., 2007.
1.2.2 Ambiguity
These changes in Canada's cryospheric components are discussed in the following chapters. Here, we stress the ambiguity of much of the available data.
To the lay person, possibly the most visible changes that are occurring relate to the worldwide shrinkage of glaciers and ice sheets. Observations of glacier length go far back in time, with written reports from travellers and explorers as early as AD 1600. In Canada, the recent shrinkage of the Athabasca Glacier in the Canadian Rockies (see Figure 15.2) in the last 30 years is highly visible to every tourist who travels the Icefields Highway from Banff to Jasper. When global data from numerous locations in both northern and southern hemispheres are compiled, there is general agreement that glaciers started to seriously retreat after AD 1850. This trend has continued well into the second half of the twentieth century, but with significant local, regional and high-frequency variability. For example, there was a slight slow-down in glacier retreat between 1970 and 1990. However, precipitation-driven growth and advances of glaciers in western Scandinavia and New Zealand occurred during the late 1990s (Chinn et al., 2005).
A different way of looking at the retreat of glaciers and ice sheets is to examine the mass balance at the surface of a glacier (i.e. the gain or loss of snow and ice over the annual hydrological cycle). This is determined largely by climate. Therefore, climate change will affect not only the magnitude of snow accumulation and ablation, but also the length of the mass balance seasons. Unfortunately, records are biased towards logistically and morphologically accessible glaciers. Nevertheless, data from over 300 individual glaciers clearly suggest that glacier wastage in the late twentieth century is essentially a response to post-1970 global warming (Greene, 2005).
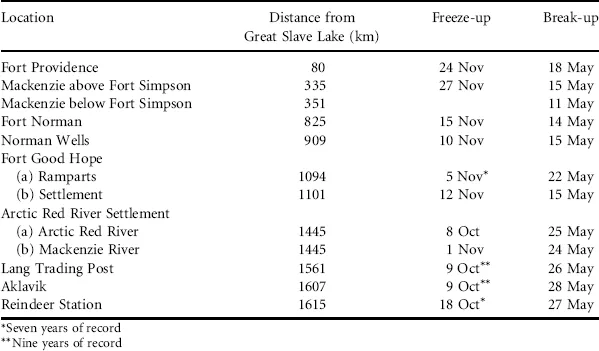
Another set of relatively long data records is provided by the freeze-up and break-up dates of river and lake ice. Such dates are of obvious importance to many human activities. In the northern hemisphere, these records extend back 150 years. A recent compilation of such records indicates that 11 out of 15 records show a significant trend towards later freeze-up, while 17 out of 25 records show a significant trend towards earlier break-up (Magnuson et al., 2000). Some of these time series data sets are shown in Figure 1.3. On balance, the average rate of change in dates for both freeze-up and break-up is approximately 5–7 days per century. On the other hand, data from some eastern Canadian rivers over the last 30 years suggest a trend towards earlier freeze-up leading to a significant decrease in open water duration (Zhang et al., 2001). In essence, it is not clear to what extent local observations on lakes and rivers reflect conditions elsewhere in the basin and it is unfortunate that there are no high elevation data included in the analysis. To further illustrate this point, Table 1.2 shows the mean freeze-up and break-up dates on the Mackenzie River, NWT, between 1946 and 1955. Naturally, there is both temporal and spatial variability in the freeze-up and break-up dates over the 1600 km distance from Great Slave Lake to the Arctic Ocean at the Beaufort Sea. This variability reflects not only latitude and climate, but also the influence of tributaries and the large water bodies at either end of the system. Russian arctic river data are equally complex; recent analyses indicate earlier freeze-up of western Russian rivers, but later freeze-up of rivers in eastern Siberia over the last 50–70 years (Smith, 2000).
Figure 1.3 Time series of freeze-up and break-up dates of several northern lakes and rivers. Source: Magnuson, et al., 2000.
Table 1.2 Mean freeze-up and break-up of the Mackenzie River, NWT, Canada, 1946–1955.
Source: Mackay, 1963
The same ambiguity characterizes recent trends in Canadian and global permafrost temperatures, as summarized by both Smith et al. (2005) and the 2007 IPCC Report (Table 1.3). For example, data from the northern Mackenzie Valley, in the continuous permafrost zone, i...
Table of contents
- Cover
- Title Page
- Copyright
- List of Contributors
- Preface
- Glossary
- Part One: Spatial and Temporal Variability of Canada's Cold Environments
- Part Two: The Changing Cryosphere
- Part Three: The Ever-Changing Scenery
- Colour Plates
- Index
Frequently asked questions
Yes, you can cancel anytime from the Subscription tab in your account settings on the Perlego website. Your subscription will stay active until the end of your current billing period. Learn how to cancel your subscription
No, books cannot be downloaded as external files, such as PDFs, for use outside of Perlego. However, you can download books within the Perlego app for offline reading on mobile or tablet. Learn how to download books offline
Perlego offers two plans: Essential and Complete
- Essential is ideal for learners and professionals who enjoy exploring a wide range of subjects. Access the Essential Library with 800,000+ trusted titles and best-sellers across business, personal growth, and the humanities. Includes unlimited reading time and Standard Read Aloud voice.
- Complete: Perfect for advanced learners and researchers needing full, unrestricted access. Unlock 1.5M+ books across hundreds of subjects, including academic and specialized titles. The Complete Plan also includes advanced features like Premium Read Aloud and Research Assistant.
We are an online textbook subscription service, where you can get access to an entire online library for less than the price of a single book per month. With over 1.5 million books across 990+ topics, we’ve got you covered! Learn about our mission
Look out for the read-aloud symbol on your next book to see if you can listen to it. The read-aloud tool reads text aloud for you, highlighting the text as it is being read. You can pause it, speed it up and slow it down. Learn more about Read Aloud
Yes! You can use the Perlego app on both iOS and Android devices to read anytime, anywhere — even offline. Perfect for commutes or when you’re on the go.
Please note we cannot support devices running on iOS 13 and Android 7 or earlier. Learn more about using the app
Please note we cannot support devices running on iOS 13 and Android 7 or earlier. Learn more about using the app
Yes, you can access Changing Cold Environments by Hugh M. French, Olav Slaymaker, Hugh M. French,Olav Slaymaker in PDF and/or ePUB format, as well as other popular books in Biological Sciences & Environmental Science. We have over 1.5 million books available in our catalogue for you to explore.