![]()
Chapter 1
Introduction
The learning of books, that you do not make your own wisdom, is money in the hands of another in time of need.
Japanese Proverb
Japanese Candlestick analysis is a highly effective but underused investment decision-making technique. Most people in the U.S. investment community are aware of Candlestick analysis, but few understand how or why it actually works. Candlestick charts reveal many insights using well-recognized Japanese Candlestick formations, yet few people understand the ramifications or significance of the signals that are clearly and reliably displayed.
This book was written to educate investors on how to use the Japanese Candlestick technique profitably. The easy-to-follow procedures detailed in this book provide the reader with profit-making techniques that can be learned quickly. More importantly, learning the principles of market psychology underlying the Candlestick methodology will revolutionize the reader’s overall investment psyche forever. While this may sound bold and far-fetched, fortunes have been made using the Japanese Candlestick techniques. Knowing how to use the Candlesticks and why they work will immediately improve the reader’s investment profitability and permanently alter overall investment perceptions. This newly acquired perception will produce consistent profits along with an associated mental reprogramming designed to maximize investment returns. Once investors become convinced of the reliability of the Candlestick methodology, they also acquire a preprogrammed investment discipline. As a result, Candlesticks add a whole new dimension to enhancing the investor’s profit-making abilities.
Most readers will be surprised at how the knowledge gained from a close reading of this book dramatically enhances investment abilities across all investment vehicles and overall trading time frames. More than 400 years of refined reversal-identification and trend continuity projection is now at the reader’s disposal. Mastering the Candlestick methodology will be the next major step for maximizing investment returns. Ten years of additional trading research has added valuable revisions to this book. Candlestick signals have one consistent aspect. They visually identify what is occurring in investor sentiment. Investor sentiment has not changed and will not change over the next 500 years. The addition of computer-generated technical indicators greatly enhances the information provided by Candlestick signals.
Why aren’t the Candlestick signals used more? Why, if the signals demonstrate such a high degree of accuracy, are there not many more investors, whether institutional or individual, using these signals? The answer is that the Candlestick technique in the past has been too labor-intensive and required a long and steep learning curve before the investor gained proficiency. This book was written to provide the reader with an easy and fast training program to circumvent those obstacles.
The Benefits of the Candlestick System
Japanese Candlestick signals possess one major attribute that is not present in other technical systems: The signals are created by the change in investor sentiment. This point is the crux of the success of Candlestick analysis. Again, to emphasize the importance of what you have just read: The signals are created by the change in investor sentiment. Understanding this truism will make it easier to adapt your investment psychology to this successful trading discipline.
This information can be utilized for successfully trading the S&P 500 e-minis as well as long-term holds. The improved computer programs have greatly enhanced the correct rate ratio associated with Candlestick analysis. Just from the year 2000 to 2010, computer scanning capabilities and execution programs have dramatically improved an investor’s capabilities for producing profits. Applying computer-generated trend analysis techniques to the Candlestick signals has greatly improved the signals’ effectiveness.
The secrets of the effectiveness of the signals can be learned in a fast and easy process. An investor does not need to be knowledgeable about technical charting to take immediate advantage of the signals. The graphical formation of a signal makes reversals immediately visible. A Candlestick formation provides a visual graphic of investor psychology during a specific time period. For the purpose of illustration in this book, the standard time frame is one day, and the trading entity is stock’equity as opposed to commodity. Investment strategies can be structured, of course, for whatever time period is suited to your trading style: minute-to-minute or monthly. Applicable trading instruments include any vehicle that has the key elements of investor fear and greed.
The graphics of a Candlestick chart have greater appeal than Western charts (commonly known as bar charts). The amount of data displayed is exactly the same, but the ease of visual interpretation is dramatically different. The immediate representative depiction of price movement as the result of investor sentiment is visually in front of you. Recognizing the change in investor sentiment is made easier when the graphics are clear and easy to understand.
Once you become accustomed to the Candlestick charts, all other charting will seem diminished in terms of effectiveness. That is not to say that other charting techniques cannot be used as “alert” functions. Candlestick signals, incorporated with other types of charts, fine-tune the reversal identification process. Watch your profits soar by simply combining Candlesticks with basic technical charting methods.
Candlestick analysis is the process for putting all the probabilities in alignment. The signals and patterns can make analyzing the market indexes very easy. If you know which direction the market should be moving, then you can establish your portfolio positions in that direction. Obviously, all boats are going to rise in a rising tide. The Candlestick signals and patterns help identify which stocks have the better upside potential. If it has been determined that the market indexes are moving positive, the next step for improving the probabilities is starting to see which of these sectors have the strongest reversal signals. From that point, each sector can be broken down into the individual stocks. Simple scanning techniques will identify which stocks have the best and most forceful reversal signals.
When you are able to identify the direction of the market, identify which sectors are moving best with the direction of the market, and finally scan for the strongest stocks in that sector, the probabilities are now greatly in your favor. These capabilities allowed the Candlestick investors to make an immense amount of money in the market decline from 2007 to March of 2009. Upon witnessing the market bottom in March of 2009, strong returns were made during the uptrend going into 2010. Fortunately, utilizing Candlestick analysis is not rocket science. It is merely utilizing the graphic depiction of investor sentiment.
A Successful History
Knowing the history of the formations inevitably imparts confidence in the Japanese Candlestick technique. Since Japanese rice traders developed the system long ago, it must have credible features. The history of the rice traders who developed the signals reinforces that assumption. With its 400 years of development, the Candlestick methodology got its major refinement in the mid-1700s.
Kosaku Kato (1716–1803) was born in the city of Sakata (now Tamagata Prefecture) during the Tokugawa Period (Eighth Shogunate). Adopted by the Honma family, he became known as Sokuta Honma. His successful interpretation of the Candlestick formations made him the most feared and respected rice trader in Japan, and the wealth he produced for his family became legendary.
Success is a ladder that cannot be climbed with your hands in your pockets.
Japanese Proverb
Songs were written about the Honma family’s untouchable wealth, as reflected in the lyric “Nobody could ever be a Honma, but everybody would like to be at least a lord.” Their mastery of the rice market price movements was popularized in verses such as “When it shines in Sakata, it’s cloudy in Dojima. And in Edo (Tokyo), it rains.” In other words, when there is good weather in Sakata (the growing region), the prices fall on the Dojima exchange and rice prices plummet in Tokyo.
Honma’s methods are divided into two categories: the Market Sanmi No Den and Sakata’s Method. The Market Sanmi No Den rules can be summarized as:
A. Without being too greedy, analyze the time and price ratio by reviewing its past movements.
B. Aim at selling at the ceiling and purchasing at the bottom.
C. Increase the position after a rise of 100 bags from the bottom or 100 bags from the top. (The price stayed the same; the volume measured in bags changed in those days.)
D. If a trade is not working, analyze it as fast as possible. Once it is discovered to be a bad trade, liquidate it immediately and rest before putting on the next trade.
E. Liquidate 70 to 80 percent of a profitable trade, liquidating the remainder after the price has indicated a top or bottom.
The Market Sanmi No Den rules A, B, and C require that the investor study charts. Rules D and E represent investing philosophies.
Sakata’s Method is the first verifiable beginning of pattern recognition.
Although Honma did not originate Candlestick analysis, his rules and philosophies gave the technique credibility. In his early fifties, Honma wrote 160 rules that became the cornerstone of Japanese Candlestick analysis, as well as the basis for Japanese investment disciplines.
Through Candlestick recognition, the name Sokyu Honma is associated with successful investing in Japan, in the same way that the name Bill Gates is associated with successful computer program marketing in the United States. Learning to “consult” the market, as Honma did a few hundred years ago, will greatly enhance your investing probabilities in the markets today.
Consult the Market about the Market
When analyzing the market, pay attention to the market movement itself’in other words, consult the market about the market. The would-be investor has to follow the market movement like a cat that wants to catch the mouse. Charts reflect the past. Theoretically, it is not possible to predict the market’s future; yet, analyzing identifiable patterns as a prelude to a high probability result is as close as an investor can get. Repeating patterns are not 100 percent accurate, but visually verifiable probabilities can adjust the odds immensely in your favor. Identification of certain events provides a basis for predicting an occurrence. Otherwise, admonitions such as “Red sky at night, sailor’s delight” would not be in existence. Hundreds of years of weather observations produced a high probability for a reliable prediction about tomorrow’s weather. The same historical observations have made Candlestick signals highly accurate.
Commodities and currencies are much easier to evaluate with Candlestick signals. Both have the benefit of not having multiple influences to affect their price move. But stocks have confirming indicators that allow an investor to be in the correct trades at the correct time. The combination of Candlestick signals and confirming indicators allowed investors to make very good profits during the market decline from the fourth quarter of 2007 to the bottom during the first quarter of 2009. Even for investors who do not like to short, the introduction of the short funds, especially the leveraged short funds, made for very good profitability during that time frame.
“Let the markets tell you what the market is going to do”’the Japanese rice traders have made this very possible. The revisions of this book will demonstrate how to take advantage of the accurate trend analysis capabilities built into Candlestick signals.
Candlestick Charts versus Bar Charts
After using the Candlestick charts, you will find that bar charts do not provide the same clarity. Despite the fact that the same information is being conveyed, the Candlestick charts, through greater visual appeal, provide information that is more communicative than bar charts. Candlestick patterns allow the investor to identify pertinent information in a relatively fast and unencumbered manner.
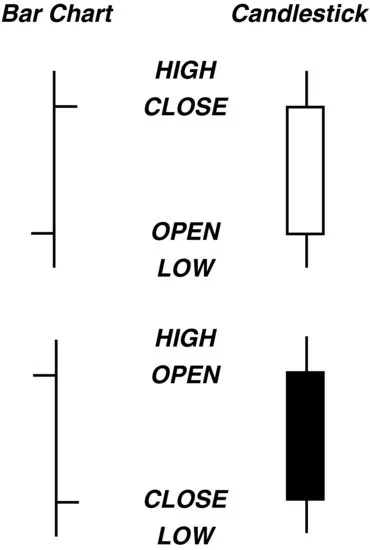
Bar Charts
A vertical line, seen here in Figure 1.1, represents the daily price movement on a bar chart. The top of the line is the high of the daily trading range; the bottom is the low of the day. A notch to the right side of the line represents the closing price. In more recent years, a notch has been added to the left side of the line to designate the opening price. Opening prices did not become readily available in stock transactions until the early 1990s. Futures and commodity charts have had access to this information for a longer period of time.
Internet charting services and software vendors provide a large number of additional technical indicators along with the charts. Fortunately, we are living in a time when software packages are constantly being developed to provide more and more technical information. This is mentioned to illustrate the benefits of technology that can be applied to better enhance the investor’s evaluations. Upon becoming accustomed to the Candlestick charts, an individual can fine-tune the probabilities of successful trades many times greater than what the capabilities would have been just a few short years ago.
Candlestick Charts
Using the same information provided in a bar chart, Japanese Candlestick charts provide immensely more illustrative graphics. As in bar charts, the open, close, high, and low are all that is required. Yet, the manner in which they are depicted provides a great amount of information to the Candlestick analyst.
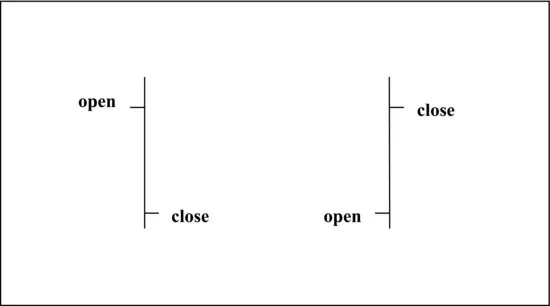
Forming the Candlesticks
Horizontal lines represent the open and the close. (See Figure 1.2.) Once both lines are added to the chart, they are boxed. This box is called the BODY. If the close is higher than the open, the body is white or empty. If the close is lower than the open, the body is black or filled. Keep in mind, this does not necessarily mean that a white body represents that the price was up for the day or that a black body represents that the price was down for the day. The body color only illustrates where the close was compared to the open.
The contrasting colors of the bodies provide for rapid visual interpretations. If a declining column of dark candles is interrupted by the appearance of a white candle, this attracts the eye immediately. This is something that would not occur when viewing conventional bar charts.
The lines extending from the body represent the extremes of the price movement during the day. These are known as the shadows. The shadow above the body is known as the upper shadow. In some...