![]()
CHAPTER 1
Where to Find Trades
An Overview
Finding trades is like finding fish. Fish can be randomly caught in any part of a lake, but they tend to congregate in specific areas at different times of the year. Similarly, big trades can be hooked at any point on a chart, but they appear with greater frequency around the edges of trading ranges.
Trading ranges do not have set patterns. Prices may twist and turn in a myriad of ways before a trading range is resolved. In general, however, trading ranges are rectangular shaped with prices swinging back and forth between the upper and lower boundaries or coiling into apexes. But we are concerned with the dynamics of trading ranges rather than any geometrical shape. When trading ranges evolve over many months or years, they often expand their boundaries and contain numerous smaller ranges. The boundaries of trading ranges are repeatedly tested and/or penetrated as the buyers and sellers struggle for dominance. Whenever the boundaries are breached, follow-through or the lack of follow-through becomes the deciding factor. After breakouts or breakdowns occur, prices often retest these areas.
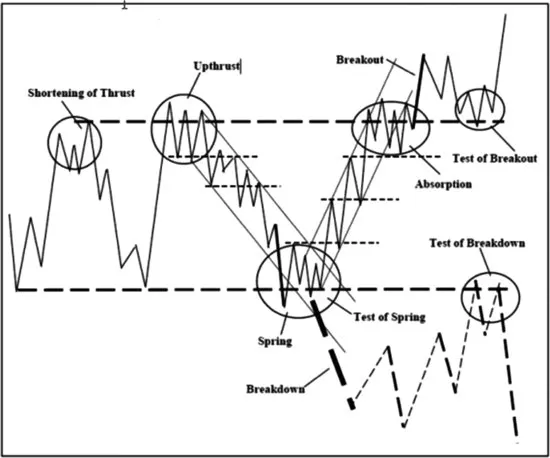
In the next few chapters, we will examine the characteristics of price/volume behavior at these various points. Keep in mind we are dealing with trading ranges of all sizes and not solely at tops or bottoms. The behavior described here occurs on all charts regardless of their time period. With practice, one can readily identify the behavior areas circled on Figure 1.1. The first step involves drawing the trading ranges—a seemingly easy task that requires an eye for horizontal relationships.
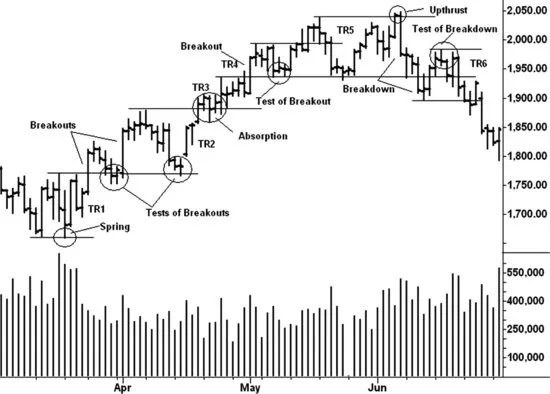
Look at the six trading ranges (TR1–TR6) on Figure 1.2 of Nasdaq futures. By repeatedly framing the support and resistance lines, we see how trends consist of individual ranges and the turning points emerge from the otherwise tangle of price movement. These turning points—springs, upthrusts, absorption, and tests of breakout/breakdowns—serve as action signals.
In later chapters, volume will be incorporated into the understanding of this price behavior. But, first, we will focus on the lines. Reading a chart without lines is like studying a world map without boundary lines. It's the subject of the next two chapters and serves as the first step in my method for reading charts.
![]()
CHAPTER 2
Drawing Lines
So much of trading and technical analysis looks easy. On the Internet, for example, you can find all sorts of trading systems showing how trades were initiated at point A and sold at point B for a 3,000 percent profit in only four months. A book on technical analysis might glorify buying breakouts or the breaking of a trend line. Trends do require breakouts in order to persist but, unfortunately, many fail. The penetration of a trend line per se guarantees little. What preceded the trend line break and the way it occurred reveals more. Then we have the skeptics who fall back on the old saying, “Lines are drawn to be broken.” So what! Price movement evolves and we redraw.
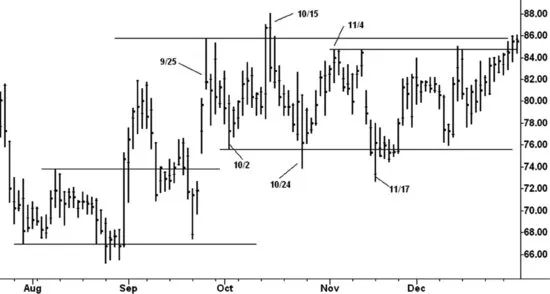
Drawing support and resistance lines might seem the subject of Charting 101. Some say it's for beginners. But you would be surprised by how many people cannot tailor the placement of their lines to highlight the behavior within a trading range. Even fewer have learned to recognize horizontal lines around which prices have revolved. Let's first look at a typical trading range and imagine we are examining Figure 2.1 of Level 3 Communications from the viewpoint of the right-most day (December 26, 2003). We see a great deal of lateral movement after the September 25 high. A resistance line is drawn across this high, and the initial low on October 2 serves as the support line. Why did I choose these two points for resistance and support levels? The high and low on October 15 and 24 could have worked equally well—maybe even better as the top occurred on October 15. In real time, I might have framed the trading range with the October high-low. But looking in retrospect from right to left, the two bold lines tell a better story. They dramatize the failures in October and November to move upward or lower. At two of these points, the sellers attempted to take control of the stock and drive prices lower. Each time, however, the buyers checked the decline and prices recovered. This is important information. It tells us the buyers remain dominant. The support line brings the struggle between the buyers and sellers into focus. During the latter half of December, notice the lifting of supports as the buyers gradually overcame the selling pressure. Such a sustained rise in price with most of the closes near the daily highs tells a more bullish story than wide flailing action. It indicates the stock is in strong hands.
The resistance line drawn across the September 25 high was penetrated on October 14, where prices registered their highest close. At this point, the buyers were seemingly in control. On the following day, however, the sellers turned back the advance and drove prices back down into the trading range. This reversal action threatened the uptrend from the August low until prices refused to break down on October 24 and November 17. Notice the October high has not played any role during this trading range. A line of resistance did form across the November 4 high as it blocked the two rallies in December. It marked the high of a trading range that began from the October 24 low. It is not uncommon to see trading ranges within larger ranges—especially when they span several months.
Since the trading range in LVLT spanned about 20 percent of the October peak price, we have to consider it of intermediate size. On hourly charts, we find many small trading ranges that swing less than 1 percent from high to low. These may last only a few days at most. While the support/resistance lines may not always tell as vivid a story about failed opportunities as we saw in LVLT, they do show (in the case of a downtrend) the steady progression of lower lows and highs.
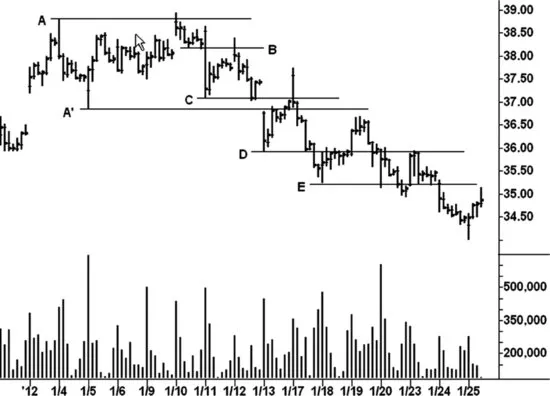
As demonstrated on the Agnico Eagle Mines hourly (Figure 2.2), the lines reveal how prices interact with previously drawn lines. Trading range AA' dominates the chart. It contains a smaller range, BC, which fails to support the market. The breakdown to support line D leads to one last rally into the larger trading range. This rally ends with an upward spike on January 17, 2012. The weak close on this price bar revealed the presence of selling. Support line D also serves as an axis line as prices repeatedly tried to recover from below it. The last of these occurred on the up-move from support line E. By drawing these lines, the trader can anticipate price swings to peak or bottom around previous support/resistance lines. They become an important part of a trader's arsenal—especially when combined with trend lines, channels, and price/volume behavior.
Some of the most useful axis lines appear on daily charts. On the March 2006 bond daily chart (Figure 2.3), resistance line A, drawn across the late November 2005 high, provided support in January 2006 and resistance twice in February 2006. The two rallies in February were tests of the breakdown below line A. The axis line alone does not reveal strength or weakness; nor does it signal to buy or sell. It simply shows a level that has repeatedly served as support and resistance. Prices may have revolved around it for several weeks or months. Many times the final rally in a top formation or the final downswing in a bottom will occur along an axis line. What makes this line most meaningful is the price/volume behavior around it. But one...