![]()
Part I
Introduction
![]()
Chapter 1
Introduction
What's in this chapter?
- Introducing business intelligence and Analysis Services 2012
- Learning about the BISM multidimensional mode
- Understanding data warehousing and OLAP
- Learning about the BISM tabular mode
- Understanding self-service BI and the evolution of tabular mode
- Understanding the Microsoft Business Intelligence Semantic Model
Business intelligence (BI) refers to systems and technologies used to gain insights from data. Those systems and technologies have traditionally been built around the concept of taking operational data, typically stored in relational databases, and using it to build a data warehouse. The data in a data warehouse is usually the result of the transformation of the operational data into a form optimized for reporting and analysis, the main business activities on the data in a BI system. Key aspects of BI systems are performance and scalability. The approach to organizing data in BI systems is referred to as Online Analytical Processing, or OLAP. The OLAP approach was created to meet the needs of BI — making sense of a large amount of existing data. This is different than the approach taken by relational databases, referred to as Online Transaction Processing (OLTP), which is optimized for efficient creating and updating of individual transactions.
Microsoft SQL Server Analysis Services has grown to be the industry-leading OLAP server based on its capabilities in helping implement the requirements of traditional BI systems. In addition to the server features and support for the performance and scalability needed by BI systems, Analysis Services provides a platform and ecosystem that supports integration with applications and tools from Microsoft and other third-party companies and independent software vendors (ISVs).
Since the previous edition of this book, the BI world has changed. The push now is to expand the scope of BI to an even wider audience. In the Microsoft BI world, this started with PowerPivot, which first shipped with SQL Server 2008 R2. PowerPivot changed the way BI was done. It consisted of a client piece in the form of a free, downloadable add-in to Microsoft Excel, and a mid-tier and server piece, which shipped in the SQL Server box and was built on top of Microsoft Office SharePoint. Aside from building a product that was dependent on Microsoft Office, other new features included with PowerPivot were the VertiPaq engine, a column-oriented in-memory database technology, DAX (a new expression language that was designed to be close to Excel's expression syntax but with added functionality focused on analytics), and a new data model. This new data model differed from the UDM model in previous Microsoft BI offerings because it dealt with tables and relationships rather than dimensions, facts, and cubes. The new model was designed to be simpler and to make the benefits of BI available to a larger audience.
PowerPivot and the Managed Self-Service BI message were successful, and the Analysis Services team began work on the next version of the product. Their goal was to evolve the new tabular model beyond just PowerPivot and make its benefits available to professional BI developers. The next step in this evolution is the tabular mode of the Business Intelligence Semantic Model (BISM). BISM is the term for the new over-arching Microsoft BI model. Analysis Services 2012 is a step in the direction of where Microsoft is going with BISM. Microsoft's goal is to provide a common model for all end-user experiences using Microsoft BI technologies. Under the hood, this model consists of three layers (data access, business logic, and data model) with two different implementations of each layer corresponding to the two different modes of BISM. This evolution will take longer than a single product cycle. The Analysis Services team has laid out its roadmap for BISM at http://bit.ly/ktIzTG.
This book covers the multidimensional and tabular modes of the BI Semantic Model. The multidimensional mode is the continuing evolution of the former UDM model of Analysis Services, which was the subject of the previous two versions of this book. Parts I and II of the book cover multidimensional mode in detail. The tabular mode is the evolution of the model introduced in PowerPivot. This book covers the changes to the tabular model as implemented for BI developers in Analysis Services 2012, although PowerPivot is also covered. The tabular mode is the topic of part III of the book. The remainder of this chapter gives a conceptual overview of these two modes of the BI Semantic Model.
BISM Multidimensional Mode
If you are familiar with previous versions of Analysis Services, you are familiar with the multidimensional mode of BISM. This approach to multidimensional BI revolves around an entity known as a data warehouse.
A data warehouse is a system of records (a BI gathering system) that takes data from a company's operational databases and other data sources and transforms it into a structure conducive to business analysis. Business calculations are often performed on the organized data to further its usefulness for making business decisions. Finally, the data is made available to the end user for querying, reporting, and analysis. A data warehouse system that is cleansed and organized has optimized storage of historical records that gives the organization an intelligence gathering system to understand the dynamics of the business. Business Analytics is a function in which information workers, business analysts, and other business users investigate business data to identify patterns and trends, and make business decisions to improve their business processes. Predictive Analytics (also known as data mining) is done using mathematical models to predict future trends based on existing business data. The general approach to storing business data in a dimensional model and providing quick answers by slicing and dicing the business data is known as Online Analytical Processing (OLAP). OLAP systems are architected in different ways. The most common types are Multidimensional OLAP (MOLAP), Relational OLAP (ROLAP), and Hybrid OLAP (HOLAP). SQL Server 2012 multidimensional mode is a business intelligence platform that provides a scalable infrastructure with servers (Analysis Services and Reporting Services) and tools (Data Quality Services, Integration Services, Master Data Services, and Reporting Services) to extract, transform, cleanse, load, build, audit, query, and report on the data in your data warehouse.
In this section you learn what data warehousing is and how it relates to multidimensional business intelligence. You also look at the best approaches to warehousing with the introduction of those concepts. Data warehousing is explained in several different ways. You see how SQL Server 2012 Analysis Services puts it all together in terms of architecture — at both client and server levels.
A Closer Look at Data Warehousing
Data warehousing has existed since the early days of computers and information systems. Initially, concepts of data warehousing were referred to as Decision Support Systems (DSS). In the book Building the Data Warehouse, Bill Inmon described the data warehouse as “a subject oriented, integrated, non-volatile, and time variant collection of data in support of management's decisions.” According to Inmon, the subject orientation of a data warehouse differs from the operational orientation in OLTP systems; so a subject in a data warehouse might relate to customers, whereas an operation in an OLTP system might relate to a specific application such as sales processing and all that goes with it.
The word integrated means that throughout the enterprise, data points should be defined consistently or there should be some integration methodology to force consistency at the data warehouse level. One example would be how to represent the entity Microsoft. If Microsoft were represented in different databases as MSFT, MS, Microsoft, and MSoft, it would be difficult to meaningfully merge these in a data warehouse. The best-case solution is to have all databases in the enterprise refer to Microsoft as, say, MSFT, thereby making the merger of this data seamless. A less desirable, but equally workable, solution is to force all the variants into one during the process of moving data from the operational system to the data warehouse.
A data warehouse is referred to as nonvolatile because it differs from operational systems, which are often transactional in nature and updated regularly. The data warehouse is generally loaded at some preset interval, which may be measured in weeks or even months. This is not to say it is never measured in days; but even if updates do occur daily, that is still a sparse schedule compared to the constant changes made to transactional systems.
The final element in this definition is time variance, which is a sophisticated way to say how far back the stored data in the system reaches. For operational systems, the time period is quite short, perhaps days, weeks, or months. For the warehouse, it is quite long — typically on the order of years. This last item might strike you as self-evident because you would have a hard time analyzing business trends if your data didn't date back further than 2 months.
OLAP systems are architected in different ways depending on how the data warehouse is built. A classic OLAP system's data warehouse is built using a multidimensional store that is optimized for performance and uses dimensional models. Alternatively, the data warehouse is built using the Relational Tables in the operational databases using a specialized schema design that is optimized for storage. Hybrid OLAP is an architecture that provides performance and optimized storage. There is more to come in this chapter on the differences between relational and multidimensional databases.
Data warehousing is the process by which data created in an operational database is transformed and stored and provides a context to facilitate the extraction of business-relevant information from the source data. An operational or transactional database, such as a point-of-sale (POS) database, is transaction-based and typically normalized to reduce the amount of redundant data storage generated. The result makes for fast updates, but this speed of update capability is offset by a reduction in speed of information retrieval at query time. For speed of information retrieval, especially for the purpose of business analytics, a multidimensional database is called for. A multidimensional database is highly denormalized and therefore has rows of data that may be redundant. This makes for fast query responses because relatively few joins are involved. And fast responses are what you want while doing BI work.
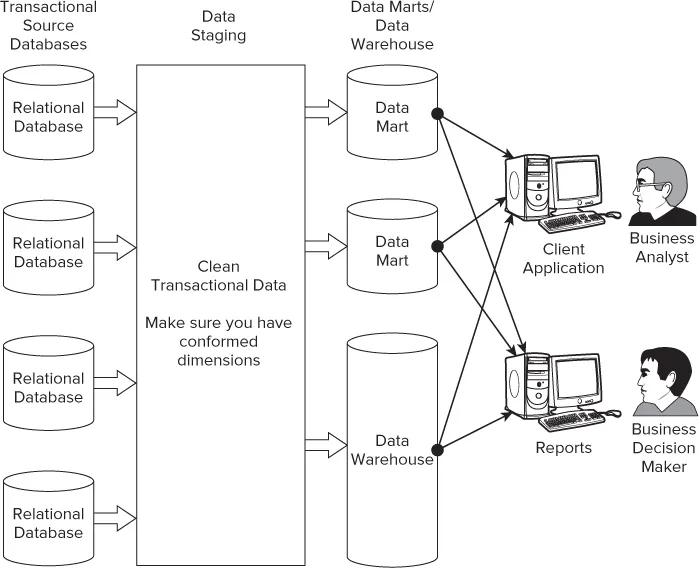
Figure 1.1 shows information extracted from transactional databases and consolidated into multidimensional databases, which is then stored in data marts or data warehouses. Data marts can be thought of as mini-data warehouses and quite often act as part of a larger warehouse. Data marts are subject-oriented data stores for well-manicured (cleaned) data. Examples include a sales data mart, an inventory data mart, or basically any subject rooted at the departmental level. A data warehouse, on the other hand, functions at the enterprise level and typically handles data across the entire organization.
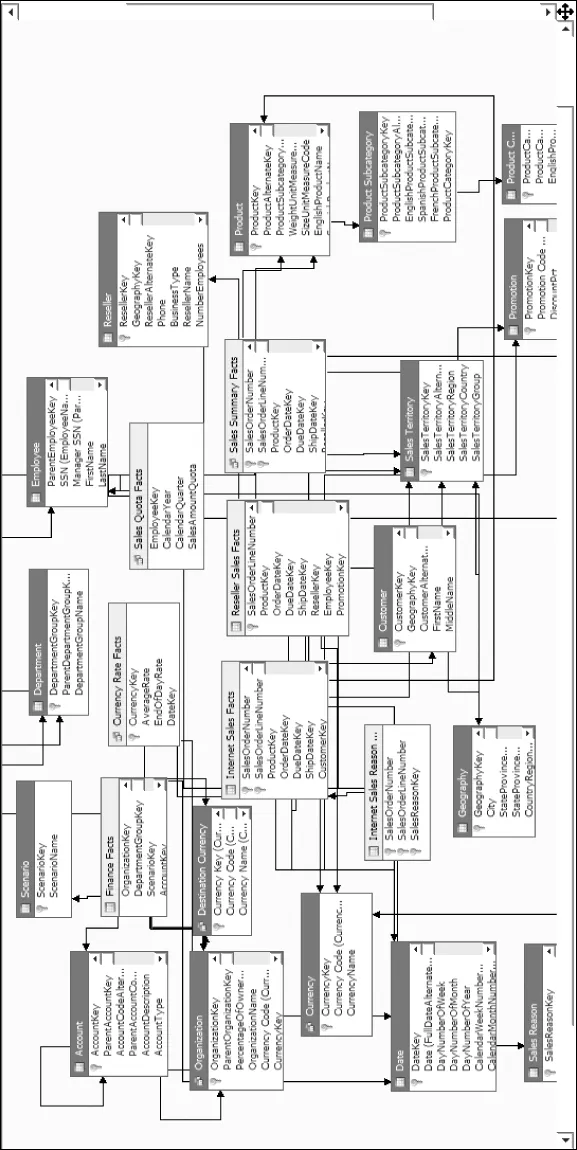
The data warehouse designer can see a consolidated view of all the objects in a data warehouse in the form of an entity relationship diagram, as shown in Figure 1.2. The appropriate level of access might be provided to the end users based on the levels of access they can see and query from the data warehouse. Even though your data warehouse might contain information about all the departments in your organization, the finance department might see only the objects relevant to finance and any other related objects for which it has access.
Key Elements of a Data Warehouse
Learning the elements of a data warehouse or data mart is, in part, about building a new vocabulary; the vocabulary associated with data warehousing can be less than intuitive, but when you get it, it all makes sense. Two kinds of tables form a data warehouse: fact tables and dimension tables.
Figure 1.3 shows a fact and a dimension table and the relationship between them. A fact table typically contains the business fact data such as sales amount, sales quantity, the number of customers, and the foreign keys to dimension tables. A foreign key is a field in a relational table that matches the primary key column of another table. Foreign keys provide a level of indirection between tables that enable you to cross-reference them. One important use of foreign ke...