![]()
CHAPTER 1
The Small-Cap Advantage
This chapter explains how exposure to the small-cap asset class can benefit both managers and institutions. First, the two sources of small-cap outperformance are introduced. The common small-cap indices are then analyzed to show that their outperformance has occurred despite some structural flaws. Finally, a discussion of market efficiency reveals how limited professional participation in the space can give diligent researchers an opportunity to outperform.
TWO SOURCES OF OUTPERFORMANCE
The small-cap advantage is the return premium that investors can experience when investing in small publicly traded companies. This performance advantage over mid caps and large caps can come from two different sources. First, investors can receive a tailwind from the historical outperformance of the asset class by confining their investment universe to small-cap stocks. Despite some handicaps that penalize small-cap index performance, small companies as a group have posted returns that exceed mid-cap and large-cap stocks over the long term. Second, investors have the opportunity to exploit greater market inefficiency in small caps. The opportunity set is larger in number, and there are fewer professionals researching and publishing information on these companies than on mid and large caps. Structural characteristics of the investment industry make it difficult for larger firms to operate within small caps, and the resulting vacuum of information creates an opportunity for diligent investors to gain an edge. The two sources of return advantage, the tailwind of outperformance and market inefficiency, must be dissected further to get a better understanding of their potential benefits and to navigate the pitfalls and traps inherent in this asset class.
SMALL-CAP DEFINITIONS
Professional investors seeking a performance advantage from investing in small companies must decide at the outset what “small cap” really means. The definition is important for two reasons. First, a manager must have a comparative benchmark, so that institutions can assess whether value is being created beyond what is available from a similar passive investment. The pressure to decide on a specific comparative benchmark is often led by clients or prospects. They desire a common measuring stick for evaluating managers and have probably chosen one of the common definitions to work into their internal processes. Second, the definition is also important because small-cap investors desire a return premium over mid-cap and large-cap stocks. For this reason, investors would seem to demand a definition that most accurately captures the segment of the market that has provided such a premium. Current industry-accepted definitions of small cap seem to have coalesced around existing standards rather than being derived from data supporting the greatest return premium.
Market capitalization is simply a snapshot dollar figure that represents the amount of capital required to purchase all outstanding shares of stock at prevailing market prices. It can range from hundreds of billions of dollars for the largest companies to hundreds of thousands of dollars for the smallest. An investor studying a company with 1 million shares of stock outstanding and a quoted market price of $50 per share would, in theory, be able to purchase the entire company for its market cap of $50 million. In general, companies with market caps below a few billion dollars are considered small in the industry.
The popular small-cap benchmarks fail to capture the highest-returning segment of small companies, and they are increasingly labeling larger companies as small. Going forward, this mislabeling is likely to diminish the historical performance advantage that small stocks have enjoyed over larger stocks. It may also make it harder for managers who restrict their investment universe to stocks included in these indices to exploit market inefficiency.
The Russell 2000® Index
The most common association that investors make with small-cap stocks is the popular Russell 2000® Index. Russell Investments launched the index in 1984, and it approximates the smallest 2,000 constituents of the Russell 3000® Index—the latter containing the largest 3,000 U.S. companies that make up approximately 98 percent of the investable U.S. equity market.1 Despite containing two-thirds of the companies in the Russell 3000, the Russell 2000 comprises only 10 percent of its total market capitalization. Investors often visualize the enormous universe of opportunity in small-cap stocks as large in size, but they often forget that the small-cap category is truly small in terms of total market capitalization. For example, the aggregate market cap of all Russell 2000 companies was roughly equivalent to that of the five largest companies in the Russell 1000 as of December 31, 2009.2
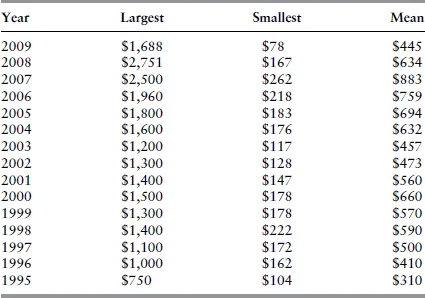
TABLE 1.1 Russell 2000 Index Constituents by Market Capitalization (in millions)
Source: Russell Investments, as of the 6/30 annual reconstitution date.3
As Table 1.1 indicates, the market-cap range for inclusion in the index correlates with up and down years in the market. The numbers also indicate that the long-term trend is for larger companies to be included in the index. Despite the periodic reconstitution of the index, the Russell 2000 is, in effect, a slave to the rank-ordering of the Russell 3000. As larger companies grow in market capitalization, small caps are gradually pulled along with them. The largest companies included in the index are more than twice as large as they were in 1995. This is important, as larger companies in cap-weighted indices have a disproportionate impact on performance. The interim periods between the yearly reconstitution of the index allow the largest companies to become even more meaningful in their impact. For example, as of December 31, 2009, the index’s largest company had a market capitalization of more than $5.5 billion.4
MSCI US Equity Small Cap 1750 Index
Another leader in indexing data, MSCI, also rank-orders the domestic stock market by size. They define small cap as the bottom 1,750 companies out of the top 2,500 in their MSCI Investable Market 2500 Index.5
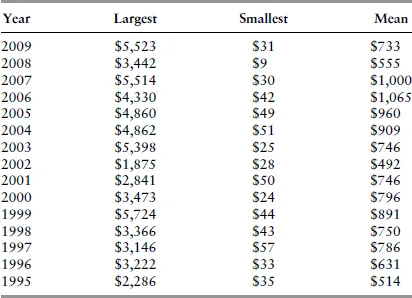
Despite having fewer companies than the Russell 2000, this index has boundaries for inclusion that are slightly wider. Again, Table 1.2 indicates a gradual increase in market cap for the average small company. The trend for MSCI’s small-cap index is also for increasingly large companies to be considered for inclusion at the upper boundary. At various times in the last decade, companies over $5 billion in market cap were considered small. The index, like the Russell 2000, is market-cap weighted, and because such large companies are included in the index, performance can become top-heavy.
TABLE 1.2 MSCI US Equity Small Cap 1750 Index Constituents by Market Capitalization (in millions)
Source: MSCI Barra, as of calendar year-end.
The S&P SmallCap 600
The Standard & Poor’s (S&P) SmallCap 600 was introduced in 1994 and covers approximately 3 percent of total domestic stock market capitalization. Even though the market-cap eligibility for inclusion in this index stretches from approximately $250 million to $1.2 billion, the largest company in the index had grown to $3.1 billion as of June 18, 2010.6 An interesting attribute of this index is that inclusion is done on an as-needed basis, which S&P claims is an improvement over the method used by the popular Russell 2000, as the latter’s summer reconstitution may have allowed traders to game the index before Russell revised its procedures to lessen its impact. Their avoidance of a defined reconstitution date has made the changes to S&P’s small-cap index less predictable. This, coupled with its smaller relative market caps, has caused a slight historical performance disparity in favor of S&P’s small-cap index over Russell’s.7
The Dow Jones U.S. Small-Cap Total Stock Market IndexSM
The Dow Jones U.S. Small-Cap Total Stock Market IndexSM is part of the Dow Jones size-segmented total stock market index lineup and was introduced in February 2005. This segment includes 1,693 stocks and broadly, but not precisely, represents stocks 751 through 2,500 ranked by market capitalization. The index offers monthly data back to 1991. Constituents are reviewed quarterly, and the aggregate market cap of the small-cap index is roughly 10 percent of total market cap.8 Both the S&P and Dow Jones Small-Cap indices are weighted by market capitalization.
Index Returns
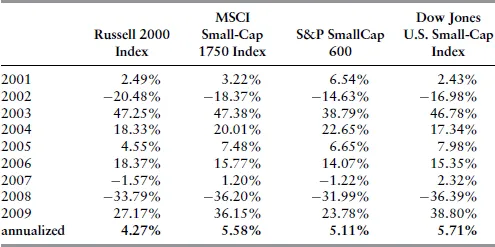
All of the indices listed in Table 1.3 vary slightly in their methodologies for inclusion and reconstitution. Certain indices use float-based metrics that can exclude companies where insiders own a high percentage of shares outstanding. Others have minimum requirements for stock price and daily liquidity. But they all attempt to capture a certain segment of the market that lies below the mid-cap and large-cap universe. Each represents a small sliver of total U.S. market capitalization, and their performance disparities are the result of different inclusion methodologies. In general, the indices that include smaller companies outperform the indices that include larger ones, but by this very fact, they also become less “investable” to those seeking to replicate their performance.
TABLE 1.3 Small-Cap Index Returns
Source: Russell Investments, MSCI, Standard & Poor’s, Dow Jones Indices.
The inclusion of larger companies in these indices over time presents a problem for investors. The largest companies have a disproportionate impact on returns, but the smallest companies actually perform better. Evidence for this is introduced in the next section. Investors looking to replicate the returns of a small-cap index through an index fund, exchange-traded fund, or separate account find themselves overexposed to the worst-performing segment of the asset class and underexposed to the highest-performing segment. Market-cap weightings in indices render exposure to the smallest companies irrelevant, as drastic price moves are meaningless to overall index performance. This is why many index fund managers do not even bother purchasing many of the smallest names in their benchmark.
So what is the most appropriate definition for small cap? Fastidious managers or institutions may attempt to parse the various methodologies in order to tailor their portfolios optimally around a specific index. But the descriptions and returns of these indices illuminate a key point: Their definitions of small cap are somewhat arbitrary. They simply represent an attempt to brand a distinct segment of market capitalization along a smooth continuum. Despite being categorized as a small company, stock number 1,001 in the Russell 3000 is not necessarily “small” in any meaningful sense, any more than the 1,000th stock is “large.”
What really matters for managers and institutions is the first source of the small-cap advantage: The smallest companies have historically produced superior long-term performance results. This stems from the ability of small companies to rapidly compound smaller absolute levels of capital. Their larger peers encounter difficulty maintaining high percentage growth rates in business value as maturation and market saturation impose practical limits on expansion.
The second source of the small-cap advantage, the relative absence of professional investors engaging in company research and making informed trading decisions, also puts investors in an advantaged position if the definition of small cap becomes biased toward tiny companies. The superior return characteristics and opacity of market information in the smallest companies call for a more restrictive definition for small cap. As constituent companies grow increasingly large, the advantages inherent in the asset class begin to disappear.
There is an increasingly compelling reason for small-cap managers and their institutional clients to abandon an intensive comparison of the various indices in search of an optimal definition. While the return information presented in Table 1.3 would logically suggest that institutions should choose an index that has performed better than its peers as a benchmark for the small-cap managers they hire, changes in index methodologies are slowly creating less differentiation as they cluster around best practices. Similarly, managers may be seduced into reasoning that it is to their advantage to compare themselves to the weakest historical benchmark. But again, gradual adoption of best practices among index information providers has actually led to less differentiation in methodology, and investors should expect less return dispersion going forward. Paul Lohery, chief investment officer of Vanguard Europe, posits this same argument:
Less than a decade ago, major index providers had very different index construction methodologies, and as a consequence, indexes purportedly tracking the same market or market segment exhibited significant variation in performance. Since then, indexes have become more alike as major index providers changed their respective methodologies to incorporate best practices.9
Since index parity is likely to remain a fact of life for small-cap investors going forward, choosing a comparative benchmark is likely to be client driven. Because of its substantial history and recognition, the majority of institutions have gravitated to the industry standard Russell 2000 as their small-cap benchmark. Since many institutions compare the small-cap portion of their portfolio with this index, managers seeking funding would be wise to choose this as a benchmark, despite its minor drawbacks. Again, Paul Lohery supports this contention:
Determining the securities of relevance for a market or market segment is not a matter of mathematics or cold, hard science. The boundaries between large-cap, mid-cap, and small-cap, growth and value, and (in a growing number of cases) country of domicile are more subjective than objective. Practitioners including portfolio managers, consultants, institutions, fin...