The inside scoop on boosting sales through spot-on analytics
Retailers collect a huge amount of data, but don't know what to do with it. Retail Analytics not only provides a broad understanding of retail, but also shows how to put accumulated data to optimal use. Each chapter covers a different focus of the retail environment, from retail basics and organization structures to common retail database designs. Packed with case studies and examples, this book insightfully reveals how you can begin using your business data as a strategic advantage.
Helps retailers and analysts to use analytics to sell more merchandise
Provides fact-based analytic strategies that can be replicated with the same success the author achieved on a global level
Reveals how retailers can begin using their data as a strategic advantage
Includes examples from many retail departments illustrating successful use of data and analytics
Analytics is the wave of the future. Put your data to strategic use with the proven guidance found in Retail Analytics.
Trusted by 375,005 students
Access to over 1.5 million titles for a fair monthly price.
The purpose of this chapter is to help develop a basic understanding of retail terminology and concepts across a wide variety of backgrounds and experience levels. The one constant factor is that we are all using analytics in some form in the support of our organizations.
A significant portion of my work over the past seven years has involved using data from consumer credit card programs to improve retail in many areas. Credit card data can be found in various levels of detail, from bin range at the transaction to aggregated card type (Visa, MasterCard, etc.). I include the use of credit data within the various sections and show how it was used to improve many types of analytics.
I also include perspectives from the credit card companies, as many of these companies do not have any practical retailer experience. They constantly struggle trying to find a bridge between credit and retail. I have found analytics to be a great bridge between retail and credit companies, as the data provided by both, when combined, can be an extremely important source of insights. Helping these credit companies understand retail organizations will, in the end, help retailers.
RETAILER GOODWILL
Goodwill can be described as those warm and fuzzy feelings that make the clients feel that you have their best interests at heart, and it is important to show that you and your analytics team are not singularly focused on your business at the expense of the retailer’s business. Fuzzy metrics are very hard to measure mathematically and, as such, are difficult to grade for performance. Customer relationship management (CRM) is all about the customer, which, in this case, is your client, the retailer. While in the global General Electric (GE) role, GE analytics teams had to manage the customer-client relationship. But instead of just getting the end customer to use more of our card services, we also wanted to have a positive influence so that the clients (retailers, in most cases) would request more products from GE, seek more consultation from analytics, and allow us more involvement within their inner circle. All of these outcomes are very positive, but again, difficult to equate back to any financial gain. Do not lose sight of the importance of these soft benefits; they can be long-term relationship builders. One aspect that can be measured is contract continuation versus renegotiations. Another strong indicator of how the client is feeling toward you is its willingness to recommend either you or your organization to its peers, often referred to as a net promoter score. This can be absolutely invaluable in the business community, and is now a key performance indicator (KPI) in evaluating many businesses.
THE INSIDE SCOOP: RETAIL POWER BROKERS
More often than not, the merchants and buyers are the real operators within the retail business. They pay the bills and bring in the profit. If you can show that increased credit card usage or fact-based analytics will sell more products, they will listen. Remember, the retailer business is selling merchandise, not credit.
Also keep in mind that these are increasingly competitive times for all retailers, and saving fees can be a very important aspect of the retailer’s budgeting. So, interchange fees (those fees paid to process credit card transactions) can be of interest to finance and the budgeting areas, but of little interest to the merchants. If you can show that data usage will give the buyer (brand manager) a competitive advantage, she will pay attention.
Almost without fail, retailers are set up in a hierarchical arrangement. There will be different groups within the merchant buying area, usually apparel, hard lines, commodities, sporting goods, and so on. While managing the credit card analytics area, I have found it easiest to align with the head of one merchandise area that best suits credit card marketing, maybe an early adopter (someone who easily accepts new concepts). When you align with this person, try to make it a win for the retailer with some tangible benefits for the card. Once you have some incremental cases that show a win for your partner, you are now able to begin some peer pressure tactics—“If this worked well for partner X, why don’t you try this, too?”
This process takes patience and time, but it is well worth the effort. Remember, the merchants are without doubt the moneymakers for retailers, and hold the influence. Having them as partners is important and worth the effort. It is crucial to understand the retailers’ language, and to communicate back to them in terms they understand and feel comfortable with. If you are to gain their trust, they have to be comfortable that you understand them and their business.
RETAIL ORGANIZATION
Within most retailers, there is a basic organizational structure. The unit that brings in the profit is the merchandise group, most often managed by the general manager or vice president. This individual will be in charge of a full line of merchandise (e.g., apparel, commodities, groceries, entertainment). Below this level is the lead buyer, who would manage a line of goods (e.g., produce, women’s slacks, or electronics). A vice president may have as many as five lead buyers, depending on the range of products the retailer carries. Next would be a co-buyer who manages the item-level products within a single category. Another buyer that plays an important role is the re-buyer, who, in most cases, is located at the distribution center (DC). This buyer maintains the ordering flow of the goods into and out of the DC.
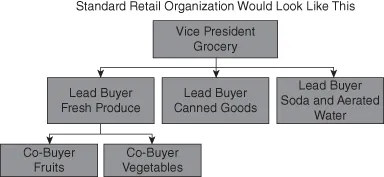
Understanding how retail businesses are organized is an important and necessary step. Many follow the standard design as shown in Exhibit 1.1. This design shows a clearly defined break in the hierarchy. Each level of the organization will require different levels of analytics support and reporting (summary versus detail). This is a simple view of a retail merchant chart.
Exhibit 1.1 Organization Chart
A standard organization chart would look like this:
One vice president: grocery
Four or five lead buyers: produce, canned goods, aerated waters, and so on
Four or five co-buyers: fruits, vegetables, and so on
Having the buy-in to your project at each level is ideal, but not always possible. Knowing the buying organization for your particular industry or retailer is critical. Each area can be particularly territorial, and being able to associate your idea with their level of control is very important.
Many organizations are developing executive information systems (EISs) for the more senior members of the organization. These are more interactive approaches to information retrieval. These systems use special reports called dashboards and are supported by smaller subsets of the organization’s databases, called cubes. Cubes are fairly complex, but for the purposes of this discussion, consider them to be big servers with predefined fields that allow for the quick loading and retrieval of specific information. Because the information fields on the cube are fixed, the fields do not change, only the most recent information does. For example, the sales data from Division One is available, so you can view this information. The most recent sales information for the division level is always loaded and kept current. If you wanted to see the department-level sales, however, you would have to make a special request, as this was not designed in up front. This sounds complicated, but it is very common.
As you move down from the senior executives, you generally find less automation in the reporting and more complexity in the level of analytics. The senior group would want to know how sales are compared to the previous year. The next level down would want to know which regions were above or below the previous year. As you move down, the questions become much more exact in their analytics requirements. I have found that the questions from the senior group are more strategic and are big questions requiring more time to organize. The questions at the manager level seem to be more tactical in nature: There are far more questions and they are far more detailed.
Another observation about retailers that they use the term marketing liberally. There are all sorts of marketing roles across a retailer; I touch on just a few.
Real Estate Marketing
In real estate marketing, you will try to identify where new stores should be built. This starts off with field representatives looking at an available property and determining whether it would be a good location. There is a whole team of analysts working on an evaluation of the sales potential, the existing competitor influence, and the logistics of getting the merchandise to the store, not to mention where the new consumers are and how they would get to the store. You then bring in the finance support team, which again can be part of the real-estate marketing department. Their role is determining what breakeven would be, and how long the store would have to be open to achieve this magic number. I worked in real estate marketing for a few years and found it fascinating and a great learning experience. The range of high-level SAS analytics was extensive, from designing distance and square-foot algorithms to building models to determine the transfer rate of sales from specific competitors. Transfer rates are the effect of moving sales from a consumer at Store 12345 to Store 45678. This sounds simple, but it is really very complex. GIS, or geographic information systems (detailed in Chapter 4), are an integral part of this department, as the utilities for calculating multiple factors at the same time are enormous. If you like high-powered analytics and learning about vector and thematic mapping, I would highly recommend this field.
Creative Advertising Marketing
Creative advertising is more of a traditional marketing area, in which you work with the design side of the business. Which colors are in trend right now, what products should be advertised to bring in more shoppers, and what type of media should be used (e.g., radio, television, print, or billboard)? This area can also include which geographies to advertise in, which could be the local television network or a cable network. Many times, this area has an analytics team to help develop the results of each promotion, and can include very advanced market-mix analysis. There are times—quite frequently, actually—when multiple media are running at the same time. To judge which media type was contributin...
Table of contents
Cover
Table of Contents
Series
Title
Copyright
Preface
Acknowledgments
Chapter 1: Retailing Analytics: An Introduction
Chapter 2: Retail and Data Analytics
Chapter 3: The Apparel Industry
Chapter 4: Importance of Geography and Demographics
Chapter 5: In-Store Marketing and Presentation
Chapter 6: Store Operations and Retail Data
Chapter 7: Loyalty Marketing
Glossary
About the Author
Index
End User License Agreement
Frequently asked questions
Yes, you can cancel anytime from the Subscription tab in your account settings on the Perlego website. Your subscription will stay active until the end of your current billing period. Learn how to cancel your subscription
No, books cannot be downloaded as external files, such as PDFs, for use outside of Perlego. However, you can download books within the Perlego app for offline reading on mobile or tablet. Learn how to download books offline
Perlego offers two plans: Essential and Complete
Essential is ideal for learners and professionals who enjoy exploring a wide range of subjects. Access the Essential Library with 800,000+ trusted titles and best-sellers across business, personal growth, and the humanities. Includes unlimited reading time and Standard Read Aloud voice.
Complete: Perfect for advanced learners and researchers needing full, unrestricted access. Unlock 1.5M+ books across hundreds of subjects, including academic and specialized titles. The Complete Plan also includes advanced features like Premium Read Aloud and Research Assistant.
Both plans are available with monthly, semester, or annual billing cycles.
We are an online textbook subscription service, where you can get access to an entire online library for less than the price of a single book per month. With over 1.5 million books across 990+ topics, we’ve got you covered! Learn about our mission
Look out for the read-aloud symbol on your next book to see if you can listen to it. The read-aloud tool reads text aloud for you, highlighting the text as it is being read. You can pause it, speed it up and slow it down. Learn more about Read Aloud
Yes! You can use the Perlego app on both iOS and Android devices to read anytime, anywhere — even offline. Perfect for commutes or when you’re on the go. Please note we cannot support devices running on iOS 13 and Android 7 or earlier. Learn more about using the app
Yes, you can access Retail Analytics by Emmett Cox in PDF and/or ePUB format, as well as other popular books in Business & Retail Industry. We have over 1.5 million books available in our catalogue for you to explore.