![]()
CHAPTER 1
Using the Elliott Wave Principle to Evaluate Mass Psychology
In this first chapter I will help you develop a better understanding of balance and proportion throughout market price data. As the discussion evolves we will be able to consider the sentiment of market participants and why the price movement defines patterns we will find to be repeatable reactions in any time frame. It is so important to understand how to read price data and to see the geometric relationships that occur within a chart, that it would be very helpful for you to read this chapter and then turn to your own computer screen to use the tools described here to work with your own charts. Taking time now to make your own observations and develop your eye with regards to proportion will make the study of the Elliott Wave Principle so much easier for you later.
Geometry is the heart and soul of harmonious relationships in solids and flat two-dimensional shapes. Simply stated, the individual elements often have proportional ratios that connect one unit to another.
The study of ratios can become extremely complex. As an example, music theory is a specialized field of mathematical ratios with specific divisor properties. But we do not need to get complex right out of the starting gate because the math can be hidden behind illustrations of simple shapes and lines. Eventually you will want to answer why specific proportional ratios are more important in markets than other ratios. But the added depth does not necessarily make you a better analyst of market action.
Geometric Proportion in Market Data
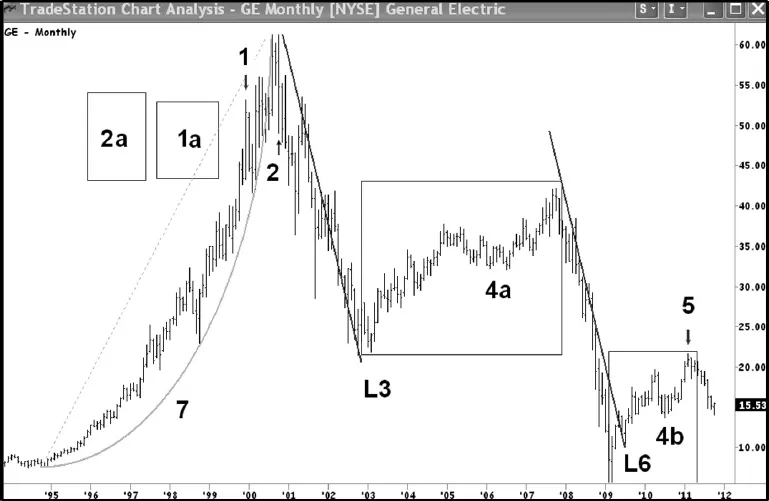
Figure 1.1 helps me continue the discussion about balance and proportion that began in the Introduction. In my experience, the traders who struggle with the Elliott Wave Principle (EWP) do not see critical elements within price data. As example, one of the considerations about the health of a trend is to always be aware of the length of the longest bar in the time horizon of interest. Figure 1.1 is a monthly chart of General Electric. The longest bar in the uptrend is marked by an arrow and the number ‘1’. However, in a single month a decline developed from the high at ‘2’ that exceeded the length of bar ‘1’. Some of you will not be able to see this, so use the boxes drawn to the left of the chart. The height of box ‘1a’ is the price range during month ‘1’. The height of box ‘2a’ is the price range during the declining month marked ‘2’. The width of the box means nothing, but if I dropped down to a daily chart, how would these two box widths compare? They would be equal provided both months had the same number of days. You will likely continue to study the bars and believe a different bar is longer than ‘1’ as the final rally unfolds. But that is why I used a box as a ruler that is easily moved to new positions for comparison within the chart. The bar marked ‘1’ is indeed the longest within the entire uptrend.
The rally can be described as a parabolic move with a trend at ‘7’ best drawn with an arc. Did you know a parallel channel of the same arc drawn as support can be set as resistance early in the move? It is never a parallel channel as parabolic rallies eventually go perpendicular. Nasdaq in 2000 and this stock both end the stellar rise before the two arcs have a chance to come together into the top. I’ll let you try that on your own. As the GE chart is a monthly time frame, you should be able to copy arc ‘7’.
Consider the line ‘L3’. It is drawn from a price high to the bottom of the price low for this declining swing. If I had drawn line ‘L6’ similarly, it too would connect a swing high to a swing bottom. The slope of ‘L6’ would have been clearly steeper because less time was required. It should be fairly obvious that the second swing accelerates into the bottom of the chart relative to the distance and time required to create the drop into ‘L3’. But look what happens when I duplicate ‘L3’ and move the copied line over to the top of the counter-trend rally. The secondary pullback that follows the key reversal bottom actually uses this same angle to create a bottom at ‘L6’. It is a strong entry signal although the rally that follows is weak. How do I know it is a weak rally that follows? It is a painful upward progression because bars frequently overlap prior bars in the advance. The congestion just above ‘4b’ leads to a rally that is unsustainable as it is fully retraced. The pullbacks throughout the advance are deep relative to the range that ends at point 5. We do not even show volume, but the price action would be significantly less than the decline that tracks through line ‘L6’.
Do you notice that box ‘4a’ and box ‘4b’ have a similar internal structure? The price data does not just move across the diagonal within each box. Both have a short interval when the upward progress is lost to an interim correction. While box ‘4a’ covers more time than box ‘4b’ to develop, the proportions within each box are similar. The interim correction develops about two-thirds into the time interval for each box.
Consider the pullbacks in each box to ‘4a’ and ‘4b’. Study the space from the ‘4a’ price lows to the top of the box. Then look at the correction lows at ‘4b’ and the space to the top of its own box. Now consider these lows and the space under them to the bottom of each box. They are proportionally very similar. I didn’t say exactly the same, but they have the same look and feel. These two swings are trying to mirror one another and that spells trouble for the price high at point ‘5’.
We have not done any Elliott Wave analysis so far, but your understanding of the internal geometric components is of greater value to you than the work from someone who applies the Elliott Wave analysis incorrectly.
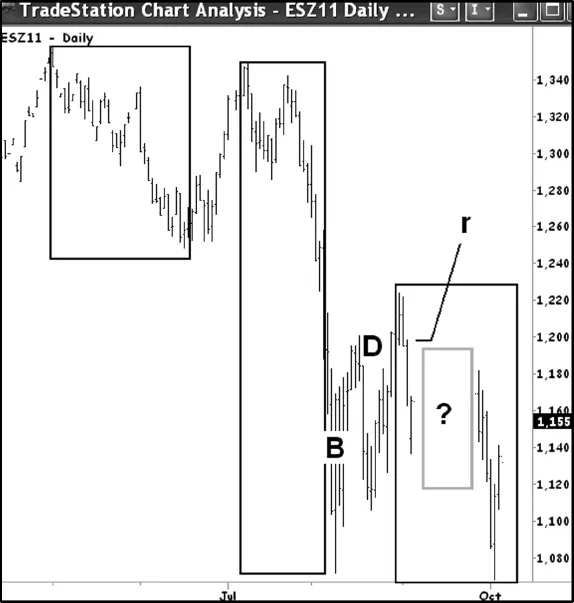
Figure 1.2 is a daily chart of the December 2011 S&P 500 mini futures contract. There are three boxes. The first box on the left is followed by a rally that nearly retraces the entire move down that is contained within the first box. The middle box is clearly a significant market decline. Then a rally follows. The price bars in the area of ‘B’ show tremendous back-and-fill. Each bar is nearly retraced by the next. The lines connect through the label ‘B’ and the battle continues into point ‘D’. This is a strong indication of market sentiment. The market decline in the middle box shows everyone is on the same side of the market. The people who thought the rally would break to new highs after the first box are caught. The people who sold early want more. The people with longer positions are in trouble when the low of the first box is exceeded within the middle. As a result everyone is selling. The key reversal bottom in the middle box would have very high volume. The price data that follows the middle box shows the battle between people believing the decline can resume to new lows versus those trying to bank profits. You also have some who think their fundamentals are aligned to buy. They have not learned you never buy a market that has just bottomed on high volume. So from the market low into point ‘D’ we see a fairly wild ride as both sides experience a choppy experience. This kind of price action is corrective. It means the final bottom is not in place. After point ‘D’ there is a drop that is fully retraced. A third box is drawn where the corrective move ends and a decline unfolds to the low just to the right of the middle box. The low should be inside the box, but you would not be able to see it as easily. It takes three swings to define the end of the correction that starts the top of the third box.
In the third box is a middle gray outlined box with a ‘?’ mark. I removed the data. Do you think the missing data is a rally that exceeds the upper boundary of the third box? Could it be a rally that stays within the ‘?’ box? How do you answer this question? Study the four bars that define the left side of the third box. Do these bars spend much time retracing the neighboring bar to the left? None. Is the slope of the decline for these four bars as steep as the slope in the decline within the middle box? Yes. That down force is back in control and the missing data in the ‘?’ box never went higher than the upper boundary of the gray box. The two bars into the top of the third box form a key reversal. From that market high there are three strong bars before I erased the middle bars. You should know there is an old floor saying for identifying a frequent level of natural resistance. It is this: The market often retraces to the start of a third wave. In this scenario consider the bar with a line pointing to it as the point of reference. The ‘r’ stands for resistance and was in fact the actual start of the decline that falls back to create a double bottom.
What do you think the volume would be at the price low in the third box compared to the volume that accompanied the first price low under ‘B’? It would be less. Oscillators would diverge to further help us define a bottom. We will add indicators after you have begun to study wave structure. But you do not need to see a volume indicator when you understand market psychology. The second decline will be the laggards, the inexperienced, and the weak hands tossing in their positions when they wrongly believed the first bottom was sustainable.
Study the bottom of the first box relative to the top of the third box. Notice the price high into the third box falls just shy of the bottom in the first box? Good. That relationship is something you must always be aware of as it will define one of our rules.
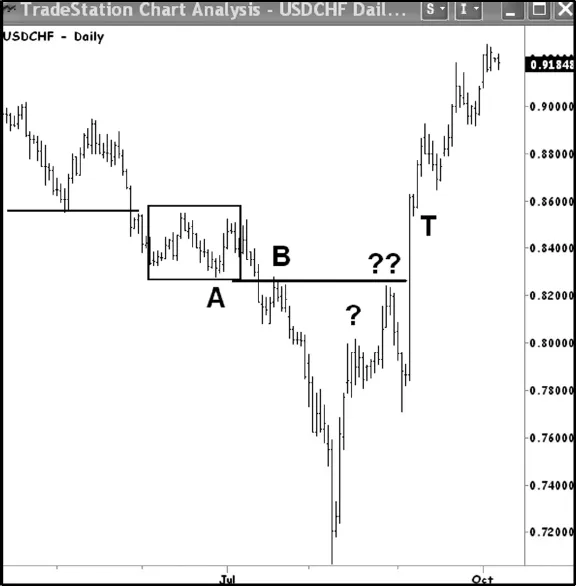
A spot currency chart is easy to read if you know how to decode it. Figure 1.3 is a daily USDCHF chart. There is no / between the currency references that reverses this order. But USDCHF refers to the U.S. dollar and Swiss franc currencies. To buy one you have to sell the other to pay for it. Therefore the first currency defines the trend. The first half of the chart shows the dollar weakening. Therefore in the first half of the chart the Swiss franc is getting stronger as the chart data declines. Then a major reversal takes place and the dollar strengthens as the Swiss franc becomes weaker. The Swiss franc was pegged to the Euro currency in an effort to weaken the Swiss franc. It is hard to sell cheese, chocolate, and such when your home currency creates a product value that is higher than at what most competitors can sell theirs. Great for Hershey’s, an American company selling their goodies overseas, but not for a Swiss-made product. So they made a change that caused this immediate move up in the dollar. Will it work and sustain this trend? Unlikely, because you will find government intervention often occurs right at the end of an Elliott Wave pattern. They get a strong reaction and then lose the battle. We will look at this wave count to see why this will fail when we have the skills in place to do so.
We can make a few important observations in Figure 1.3 without knowing Elliott Wave analysis. Notice the price action contained within a box. The price low at ‘A’ leads to another small rally and fails to reach the top of the small box. The market breaks and defines a small bounce into point ‘B’. Here is what you need to really know; the closing prices into the pivot under ‘B’ never exceed the price low that defined point ‘A’. If the market cannot close a bar into the range of the prior swing low, it has failed. Eli Tullis taught me this test and it has served me well over many years. He used to say “the market is no good” when this relationship between swings developed. It was an immediate sell because you knew you were wrong if the market could exceed the CLOSE w...