- Contributes an important advance in the practice of pain management providing the information on which to build more coherent and standardised strategies for relief of patient suffering
- Answers questions about which are the most effective methods, AND those which are not effective yet continue to be used
- Includes discussion of the positive and the negative evidence, and addresses the grey areas where evidence is ambivalent
- Written by the world's leading experts in evidence-based pain management this is a seminal text in the field of pain
eBook - ePub
Evidence-Based Chronic Pain Management
- English
- ePUB (mobile friendly)
- Available on iOS & Android
eBook - ePub
Evidence-Based Chronic Pain Management
About this book
A genuine evidence-based text for optimum pain relief in various chronic conditions
Trusted by 375,005 students
Access to over 1.5 million titles for a fair monthly price.
Study more efficiently using our study tools.
Information
Part 1
Understanding evidence and pain
CHAPTER 1
Why evidence matters
Introduction
There are two ways of answering a question about what evidence-based medicine (EBM) is good for or even what it is. One is the dry, formal approach, essentially statistical, essentially justifying a prescriptive approach to medicine. We have chosen, instead, a freer approach, emphasizing the utility of knowing when “stuff” is likely to be wrong and being able to spot those places where, as the old maps would tell us, “here be monsters.” This is the Bandolier approach, the product of the hard knocks of a couple of decades or more of trying to understand evidence.
What both of us (and Henry McQuay and other collaborators over the years), on our different journeys, have brought to the examination of evidence is a healthy dose of skepticism, perhaps epitomized in the birth of Bandolier. It came during a lecture on evidence-based medicine by a public health doctor, who proclaimed that only seven things were known to work in medicine. By known, he meant that they were evidenced by systematic review and meta-analysis. A reasonable point, but there were unreasonable people in the audience. One mentioned thiopentone for induction of anesthesia, explaining that with a syringe and needle anyone, without exception, could be put to sleep given enough of this useful barbiturate; today we would say that it had an NNT of 1. So now we had seven things known to work in medicine, plus thiopentone. We needed somewhere to put the bullet points of evidence; you put bullets in a bandolier (a shoulder belt with loops for ammunition).
The point of this tale is not to traduce well-meaning public health docs, or meta-analyses, but rather to make the point that evidence comes in different ways and that different types of evidence have different weight in different circumstances. There is no single answer to what is needed, and we have often to think outside what is a very large box. Too often, EBM seems to be corralled into a very small box, with the lid nailed tightly shut and no outside thinking allowed.
If there is a single unifying theory behind EBM, it is that, whatever sort of evidence you are looking at, you need to apply the criteria of quality, validity, and size. These issues have been explored in depth for clinical trials, observational studies, adverse events, diagnosis, and health economics [1], and will not be rehearsed in detail in what follows. Rather, we will try to explore some issues that we think are commonly overlooked in discussions about EBM.
We talk to many people about EBM and those not actively engaged in research in the area are frequently frustrated by what they see as an impossibly complicated discipline. Someone once quoted Ed Murrow at us, who, talking about the Vietnam war, said that “Anyone who isn’t confused doesn’t really understand the situation” (Walter Bryan, The Improbable Irish, 1969). We understand the sense of confusion that can arise, but there are good reasons for continuing to grapple with EBM. The first of these is all about the propensity of research and other papers you read to be wrong. You need to know about that, if you know nothing else.
Most published research false?
It has been said that only 1% of articles in scientific journals are scientifically sound [2]. Whatever the exact percentage, a paper from Greece [3], replete with Greek mathematical symbols and philosophy, makes a number of important points which are useful to think of as a series of little laws (some of which we explore more fully later) to use when considering evidence.
- The smaller the studies conducted in a scientific field, the less likely the research findings are to be true.
- The smaller the effect sizes in a scientific field, the less likely the research findings are to be true.
- The greater the number and the fewer the selection of tested relationships in a scientific field, the less likely the research findings are to be true.
- The greater the flexibility in designs, definitions, outcomes, and analytical modes in a scientific field, the less likely the research findings are to be true.
- The greater the financial and other interests and prejudices in a scientific field, the less likely the research findings are to be true. (These might include research grants or the promise of future research grants.)
- The hotter a scientific field (the more scientific teams involved), the less likely the research findings are to be true.
Ioannidis then performs a pile of calculations and simulations and demonstrates the likelihood of us getting at the truth from different typical study types (Table 1.1). This ranges from odds of 2:1 on (67% likely to be true) from a systematic review of good-quality randomized trials, through 1:3 against (25% likely to be true) from a systematic review of small inconclusive randomized trials, to even lower levels for other study architectures.
There are many traps and pitfalls to negotiate when assessing evidence, and it is all too easy to be misled by an apparently perfect study that later turns out to be wrong or by a meta-analysis with impeccable credentials that seems to be trying to pull the wool over our eyes. Often, early outstanding results are followed by others that are less impressive. It is almost as if there is a law that states that first results are always spectacular and subsequent ones are mediocre: the law of initial results. It now seems that there may be some truth in this.
Three major general medical journals (New England Journal of Medicine, JAMA, and Lancet) were searched for studies with more than 1000 citations published between 1990 and 2003 [4]. This is an extraordinarily high number of citations when you think that most papers are cited once if at all, and that a citation of more than a few hundred times is almost as rare as hens’ teeth.
Of the 115 articles published, 49 were eligible for the study because they were reports of original clinical research (like tamoxifen for breast cancer prevention or stent versus balloon angioplasty). Studies had sample sizes as low as nine and as high as 87,000. There were two case series, four cohort studies, and 43 randomized trials. The randomized trials were very varied in size, though, from 146 to 29,133 subjects (median 1817). Fourteen of the 43 randomized trials (33%) had fewer than 1000 patients and 25 (58%) had fewer than 2500 patients.
Of the 49 studies, seven were contradicted by later research. These seven contradicted studies included one case series with nine patients, three cohort studies with 40,000–80,000 patients, and three randomized trials, with 200, 875 and 2002 patients respectively. So only three of 43 randomized trials were contradicted (7%), compared with half the case series and three-quarters of the cohort studies.
Table 1.1 Likelihood of truth of research findings from various typical study architectures
| Example | Ratio of true to not true |
| Confirmatory meta-analysis of good-quality RCTs | 2:1 |
| Adequately powered RCT with little bias and 1:1 prestudy odds | 1:1 |
| Meta-analysis of small, inconclusive studies | 1:3 |
| Underpowered and poorly performed phase I–II RCT | 1:5 |
| Underpowered but well-performed phase I–II RCT | 1:5 |
| Adequately powered exploratory epidemiologic study | 1:10 |
| Underpowered exploratory epidemiologic study | 1:10 |
| Discovery-orientated exploratory research with massive testing | 1:1000 |
A further seven studies found effects stronger than subsequent research. One of these was a cohort study with 800 patients. The other six were randomized trials, four with fewer than 1000 patients and two with about 1500 patients.
Most of the observational studies had been contradicted, or subsequent research had shown substantially smaller effects, but most randomized studies had results that had not been challenged. Of the nine randomized trials that were challenged, six had fewer than 1000 patients, and all had fewer than 2003 patients. Of 23 randomized trials with 2002 patients or fewer, nine were contradicted or challenged. None of the 20 randomized studies with more than 2003 patients were challenged.
There is much more in these fascinating papers, but it is more detailed and more complex without becoming necessarily much easier to understand. There is nothing that contradicts what we already know, namely that if we accept evidence of poor quality, without validity or where there are few events or numbers of patients, we are likely, often highly likely, to be misled.
If we concentrate on evidence of high quality, which is valid, and with large numbers, that will hardly ever happen. As Ioannidis also comments, if instead of chasing some ephemeral statistical significance we concentrate our efforts where there is good prior evidence, our chances of getting the true result are better. This may be why clinical trials on pharmaceuticals are so often significant statistically, and in the direction of supporting a drug. Yet even in that very special circumstance, where so much treasure is expended, years of work with positive results can come to naught when the big trials are done and do not produce the expected answer.
Limitations
Whatever evidence we look at, there are likely to be limitations to it. After all, there are few circumstances in which one study, of whatever architecture, is likely to be able to answer all the questions we need to know about an intervention. For example, trials capturing information about the benefits of treatment will not be able to speak to the question of rare, but serious, adverse events.
There are many more potential limitations. Studies may not be properly conducted or reported according to recognized standards, like CONSORT for randomized trials (www.consort-statement.org), QUOROM for systematic reviews, and other standards for other studies. They may not measure outcomes that are useful, or be conducted on patients like ours, or present results in ways that we can easily comprehend; trials may have few events, when not much happens, but make much of not much, as it were. Observational studies, diagnostic studies, and health economic studies all have their own particular set of limitations, as well as the more pervasive sins of significance chasing, or finding evidence to support only preconceptions or idées fixes.
Perfection in terms of the overall quality and extent of evidence is never going to happen in a single study, if only because the ultimate question – whether this intervention will work in this patient and produce no adverse effects – cannot be answered. The average results we obtain from trials are difficult to extrapolate to individuals, and especially the patients in front of us (of which more later).
Acknowledging limitations
Increasingly we have come to expect authors to make some comment about the limitations of their studies, even if it is only a nod in the direction of acknowledging that there are some. This is not easy, because there is an element of subjectivity about this. Authors may also believe, with some reason, that spending too much time rubbishing their own results will result in rejection by journals, and rejection is not appreciated by pointy-headed academics who live or die by publications.
Even so, the dearth of space given over to discussing the limitations of studies is worrying. A recent survey [5] that examined 400 papers from 2005 in the six most cited research journals and two open-access journals showed that only 17% used at least one word denoting limitations in the context of the scientific work presented. Among the 25 most cited journals, only one (JAMA) asks for a comments section on study limitations, and most were silent.
Statistical testing
It is an unspoken belief that to have a paper published, it helps to report some measure with a statistically significant difference. This leads to the phenomenon of significance chasing, in which data are analyzed to death and the aim is to find any test with any data that show significance at the paltry level of 5%. A P value of 0.05, or significance at the 5% level, tells us that there is a 1 in 20 chance that the results occurred by chance. As an aside, you might want to ask yourself how happy you are with 1 in 20; after all, if you throw two dice, double six seems to occur frequently and that is a chance of 1 in 36. If you want to examine evidence with a cold and fishy eye, try recognizing significance only when it is at the 1 in 100 level, or 1%, or a P value of 0.001; it often changes your view of things.
Multiple statistical testing
The perils of multiple statistical testing might have been drummed into us during our education but as researchers, we often forget them in the search for “results,” especially when such testing confirms our pre-existing biases. A large and thorough examination of multiple statistical tests underscores the problems this can pose [6].
This was a population-based retrospective cohort study which used linked administrative databases covering 10.7 million residents of Ontario aged 18–100 years who were alive and had a birthday in the year 2000. Before any analyses, the database was split in two to provide both derivation and validation cohorts, each of about 5.3 million persons, so that associations found in one cohort could be confirmed in the other cohort.
The cohort comprised all admissions to Ontario hospitals classified as urgent (but not elective or planned) using DSM criteria, and ranked by frequency. This was used to determine which persons were admitted within the 365 days following their birthday in 2000, and the proportion admitted under each astrological sign. The astrological sign with the highest hospital admission rate was then tested statistically against the rate for all 11 other signs combined, using a significance level of 0.05. This was done until two statistically significant diagnoses were identified for each astrological sign.
In all, 223 diagnoses (accounting for 92% of all urgent admissions) were examined to find two statistically significant results for each astrological sign. Of these, 72 (32%) were statistically significant for at least one sign compared with all the others combined. The extremes were Scorpio, with two significant results, and Taurus, with 10, with significance levels of 0.0003 to 0.048.
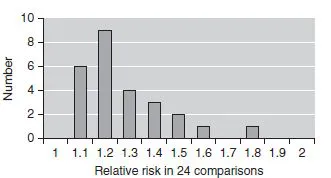
The two most frequent diagnoses for each sign were used to select 24 significant associations in the derivation cohort. These included, for instance, intestinal obstructions and anemia for people with the astrological sign of Cancer, and head and neck symptoms and fracture of the humerus for Sagittarius. Levels of statistical significance ranged from 0.0006 to 0.048, and relative risk from 1.1 to 1.8 (Fig. 1.1), with most being modest.
Protection against spurious statistical significance from multiple comparisons was tested in several ways.
When the 24 associations were tested in the validation cohort, only two remained significant: gastrointestinal haemorrhage and Leo (relative risk 1.2), and fractured humerus for Sagittarius (relative risk 1.4).
Using a Bonferoni correction for 24 multiple comparisons would have set the level of significance acceptable as 0.002 rather than 0.05. In this case, nine of 24 comparisons would have been significant in the derivation cohort, but none in the both derivation and validation cohort. Correcting for all 14,718 comparisons used in the derivation cohort would have meant using a significance level of 0.000003, and no comparison would have been significant in either derivation or validation cohort.
Figure 1.1 Relative risk of associations between astrological sign and illness for the 24 chosen associations, using a statistical significance of 0.05, uncorrected for multiple comparisons.
This study is a sobering reminder that statistical significance can mislead when we don’t use statistics properly: don’t blame statistics or the statisticians, blame our use of them. There is no biologic plausibility for a relationship between astrological sign and illness, yet many could be found in this huge data set when using standard levels of statistical significance without thinking about the problem of multiple comparisons. Even using a derivation and validation set did not offer complete protection against spurious results in enormous data sets.
Multiple subgroup analyses are common in published articles in our journals, usually without any adjustment for multiple testing. The authors examined 131 randomized trials published in top journals in 6 months in 2004. These had an average of five subgroup analyses, and 27 significance tests for efficacy and safety. The danger is that we may react to results that may have spurious statistical significance, especially when the size of the effect is not large.
Size is everything
The more important question, not asked anything like often enough, is whether any statistical testing is appropriate. Put another way, when can we be sure that we have enough information to be sure of the result, using the mathematical perspective of “sure,” meaning the probability to a certain degree that we are not being mucked about by the random play of chance? This is not a trivial question, given that many results, especially concerning rare but serious harm, are driven by very few events.
In a clinical trial of drug A against placebo, the size of the trial is set according to how much better drug A is expected to be. For instance, if it is expected to be hugely better, the trial will be small but if the improvement is not expected to be large, the trial will have to be huge. Big effect, small trial; small effect, big trial; statisticians perform power calculations to determine the size of the trial beforehand. But remember that the only thing being tested here is whether the prior estimate of the expected treatment effect is actually met. If it is, great, but when you calculate the effect size from that trial, using number needed to treat (NNT), say, you probably have insufficient information to do so because the trial was never designed to measure the size of the effect. If it were, then many more patients would have been needed.
In practice, what is important is the size of the effect – how many patients benefit. With individual trials we can be misled. Figure 1.2 shows an example of six large trials (213–575 patients, 2000 in all) of a single oral dose of eletriptan 80 mg for acute migraine, using the outcome of headache relief (mild or no pai...
Table of contents
- Cover
- Title page
- Copyright
- List of contributors
- Preface
- List of abbreviations
- Part 1: Understanding evidence and pain
- Part 2: Clinical pain syndromes: the evidence
- Part 3: Cancer pain
- Part 4: Treatment modalities: the evidence
- Index
Frequently asked questions
Yes, you can cancel anytime from the Subscription tab in your account settings on the Perlego website. Your subscription will stay active until the end of your current billing period. Learn how to cancel your subscription
No, books cannot be downloaded as external files, such as PDFs, for use outside of Perlego. However, you can download books within the Perlego app for offline reading on mobile or tablet. Learn how to download books offline
Perlego offers two plans: Essential and Complete
- Essential is ideal for learners and professionals who enjoy exploring a wide range of subjects. Access the Essential Library with 800,000+ trusted titles and best-sellers across business, personal growth, and the humanities. Includes unlimited reading time and Standard Read Aloud voice.
- Complete: Perfect for advanced learners and researchers needing full, unrestricted access. Unlock 1.5M+ books across hundreds of subjects, including academic and specialized titles. The Complete Plan also includes advanced features like Premium Read Aloud and Research Assistant.
We are an online textbook subscription service, where you can get access to an entire online library for less than the price of a single book per month. With over 1.5 million books across 990+ topics, we’ve got you covered! Learn about our mission
Look out for the read-aloud symbol on your next book to see if you can listen to it. The read-aloud tool reads text aloud for you, highlighting the text as it is being read. You can pause it, speed it up and slow it down. Learn more about Read Aloud
Yes! You can use the Perlego app on both iOS and Android devices to read anytime, anywhere — even offline. Perfect for commutes or when you’re on the go.
Please note we cannot support devices running on iOS 13 and Android 7 or earlier. Learn more about using the app
Please note we cannot support devices running on iOS 13 and Android 7 or earlier. Learn more about using the app
Yes, you can access Evidence-Based Chronic Pain Management by Cathy Stannard, Eija Kalso, Jane Ballantyne, Cathy Stannard,Eija Kalso,Jane Ballantyne in PDF and/or ePUB format, as well as other popular books in Medicine & Anesthesiology & Pain Management. We have over 1.5 million books available in our catalogue for you to explore.