![]()
Chapter 1
Colour Vision
1.1 Introduction
Ten million! That is the number of different colours that we can distinguish, according to one reliable estimate (Judd and Wyszecki, 1975). It is, therefore, no wonder that we cannot remember colours well enough to identify a particular shade. People are thus well advised to take samples of their clothing colours with them when purchasing accessories that are intended to match. They are also usually well aware that it is not enough to examine the colour match in just one type of light in a shop, but to see it in daylight as well as in artificial light. Finally, a second opinion about the match, expressed by a friend or a shop assistant, is often wisely sought.
The above activity involves the three basic components of colour: sources of light, objects illuminated by them and observers. Colour, therefore, involves not only material sciences, such as physics and chemistry, but also biological sciences, such as physiology and psychology; and, in its applications, colour involves various applied sciences, such as architecture, dyeing, paint technology, and illuminating engineering. Measuring colour is, therefore, a subject that has to be broadly based and widely applied.
Without observers possessing the faculty of sight, there would be no colour. Hence it is appropriate to start by considering the nature of the colour vision provided by the human eye and brain. Before doing this, however, a brief description must be given of the way in which it is necessary to characterise the nature of the light which stimulates the visual system.
1.2 The Spectrum
It is fair to say that understanding colour finds its foundations in the famous experiments performed by Isaac Newton in 1666. Before this date, opinions on the nature of colours and the relationships between them were most vague and of very little scientific use, but, after Newton's work became known, a way was open for progress based on experimental facts.
The historic experiments were performed in Trinity College, Cambridge, when Newton made a small hole, a third of an inch in diameter, in the shutter of an otherwise entirely dark room; through this hole, the direct rays of the sun could shine and form an image of the sun's disc on the opposite wall of the room, like a pin-hole camera. Then, taking a prism of glass, and placing it close to the hole, he observed that the light was spread out fan-wise into what he was the first to call a spectrum: a strip of light, in this case about ten inches long, and coloured red, orange, yellow, green, blue, indigo, and violet, along its length. The natural conclusion, which Newton was quick to draw, was that white light was not the simple homogeneous entity which it was natural to expect it to be, but was composed of a mixture of all the colours of the spectrum.
The next question which arose was whether these spectral colours themselves, red, green, etc., were also mixtures and could be spread out into further constituent colours. A further experiment was performed to test this suggestion. A card with a slit in it was used to obscure all the light of the spectrum, except for one narrow band. This band of light, say a yellow or a green, was then made to pass through a second prism, but the light was then seen not to be spread out any further, remaining exactly the same colour as when it emerged from the slit in the card. It was, therefore, established that the spectral colours were in fact the basic components of white light.
The inclusion by Newton of indigo in the list of spectral colours is rather puzzling since, to most people, there appears to be a gradual transition between blue and violet with no distinct colour between them, as there is in the case of orange between red and yellow. Several explanations of the inclusion of indigo have been suggested, but the most likely is that Newton tried to fit the colours into a scale of tones in a way analogous to the eight-tone musical scale; to do this he needed seven different colours to correspond to the seven different notes of the scale (McLaren, 1985).
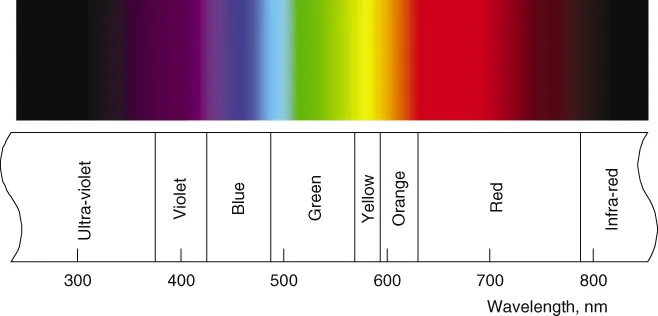
In Figure 1.1, the main bands of colour in the spectrum are shown against a scale of the wavelength of the light. Light is a form of electro-magnetic radiation, as is also the case for x-rays, radar, and radio waves, for instance, and the property of this radiation that gives it particular characteristics is its wavelength. Radio waves have quite long wavelengths, typically in the range from about a metre to several kilometres, whereas x-rays have extremely short wavelengths, typically about a millionth of a millimetre or shorter. Light waves have wavelengths in between, ranging from slightly above to slightly below a half a millionth of a metre. To obtain convenient numbers for the wavelengths of light, the unit used for expressing them is the nanometre (abbreviation, nm), which is a millionth of a millimetre, or 10−9 of a metre; this is the unit used in Figure 1.1. It must be emphasised that the colour names and wavelength boundaries given in Figure 1.1 are only intended as a rough guide; each colour gradually merges into the next so that there is really no exact boundary; moreover, the colour appearance of light of a given wavelength depends on the viewing conditions, and is also liable to be slightly different from one observer to another. Even so, the names given in Figure 1.1 are useful to bear in mind when considering data that are presented as functions of wavelength. Radiation having wavelengths longer than those of the visible spectrum and less than about 1 mm is called infrared; and that having wavelengths shorter than those of the visible spectrum and longer than about 100 nm is called ultraviolet. These radiations can provide radiant energy that tans the skin or warms the body, for instance, but they cannot normally be seen as light. In colour science, although it is the long-established practice to identify different parts of the spectrum by using wavelength, it would be more fundamental to use frequency. This is because, for light from any part of the spectrum, as it passes through a medium, its wavelength decreases by being divided by the refractive index of that medium; however, the velocity also decreases in the same proportion, so that the frequency (the velocity divided by the wavelength) remains constant. The values of wavelength quoted are usually as measured in air, and, although those measured in vacuum would be more fundamental, they differ by only about 3 parts in 10 000. (The velocity of light in vacuum is about 2.998 × 10⁸ metres per second.)
1.3 Construction of the Eye
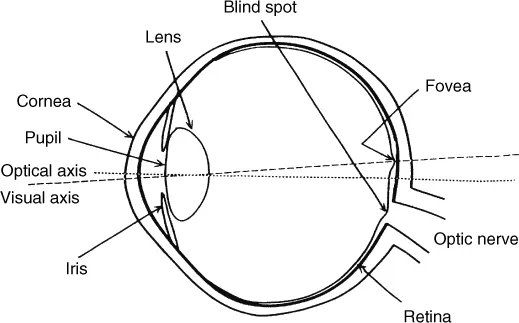
A diagrammatic representation of a cross-section of the human eye is given in Figure 1.2. Most of the optical power is provided by the curved surface of the cornea, and the main function of the lens is to alter that power by changing its shape, being thinner for viewing distant objects and thicker for near objects. The cornea and lens acting together form a small inverted image of the outside world on the retina, the light-sensitive layer of the eye. The iris, the annular-shaped coloured part of the eye that we see from the outside, changes its shape, having a central aperture that is only about 2 mm in diameter in bright light, but which is larger in dim light, having a maximum diameter of about 8 mm. The aperture referred to is called the pupil, and is the area through which the light passes. The iris, by changing its diameter, provides some compensation for changes in the level of illumination under which objects are seen; however, this compensation only amounts to a factor of about 8 to 1, rather than the 16 to 1 to be expected from the ratio of the squares of the diameters, because rays that pass through the edge of the pupil are less effective in stimulating the retina than those that pass through the centre, a property known as the Stiles-Crawford effect.
The retina lines most of the interior of the approximately spherically-s...