![]()
CHAPTER 1
INTRODUCTION
1.1 OVERVIEW
Across the spectrum of human enterprise in government, business, and science, data-intensive systems are changing the scale, scope, and nature of the data to be analyzed. In data-intensive science (Hey et al., 2009), various instruments such as the Australian Square Kilometre Array (SKA) of radio telescopes (www.ska.gov.au), the CERN Hadron particle accelerator (http://public.web.cern.ch/public/en/lhc/Computing-en.html), and the Pan-STARRS array of celestial telescopes (http://pan-starrs.ifa.hawaii.edu/public/design-features/data-handling.html) are complex systems sending petabytes of data each year to a data center. An experiment for drug discovery in the pharmaceutical and biotechnology industries might include high-throughput screening of hundreds of thousands of chemical compounds against a known biological target, or high-content screening of a chemical agent against thousands of molecular cellular components from cancer cells, such as proteins or messenger RNA. Data-intensive science has been called the fourth paradigm that requires a transformed scientific method with better tools for the entire research cycle “from data capture and data curation to data analysis and data visualization.” (Hey et al., 2009)
In 2004, the Department of Homeland Security chartered the National Visualization and Analytics Center (NVAC) to direct and coordinate research and development of visual analytics technology and tools. Its major objectives included defining a long-term research and development agenda for visual analytics tools to help intelligence analysts combat terrorism by enabling insights from “overwhelming amounts of disparate, conflicting, and dynamic information.” (Thomas & Cook, 2005) This has given rise, more broadly, to the emerging field of visual analytics. The field seeks to integrate information visualization with analytical methods to help analysts and researchers reason about complex and dynamic data and situations. But why the emphasis on visualization as a key element in the solution to helping with the problem of data overload?
In 1994, Frederick Brooks in an acceptance lecture given for the ACM Allen Newell Award at SIGGRAPH said:
As shown in Fig. 1.1, to effectively design intelligence amplifying (IA) systems requires an understanding of what goes on in the mind as it interacts with a visual system. Clues about how the mind interprets the digital world come from what is known about how the mind interprets the physical world, a subject that has been studied in vision science.
1.2 VISUAL PERCEPTION
Imagine yourself driving into an unfamiliar large metropolitan city with a friend on a very crowded multilane expressway. Your friend, who knows the city well, is giving you verbal directions. You come to a particularly complicated system of exits, which includes your exit, and your friend says “follow that red sports car moving onto the exit ramp.” You check your rearview mirror, look over your shoulder, engage your turn signal, make the appropriate adjustments to speed, and begin to move into the space between the vehicles beside you and onto the exit ramp. Had this scenario taken place, you would have been using visual perception to inform and guide you in finding your way into an unfamiliar city.
The human visual system, which comprises nearly half of the brain, has powerful mechanisms for searching and detecting patterns from any surface that reflects or emits light. In the imagined scenario, the optic flow of information moment by moment from various surfaces—the paint on the road dividing the lanes, the vehicles around you, the traffic signs, the flashing lights of turn signals or brake lights—creates scenes taken in and projected onto the retinas at the back of the left and right eyes as upside-down, two-dimensional (2-D) images. The visual system, through various processes executed by billions of highly connected biological computational elements called neurons operating in parallel, extracts information from a succession of these pairs of images in a fraction of a second and constructs a mental representation of the relevant objects to be aware of while navigating toward the exit ramp and their location in the external world.
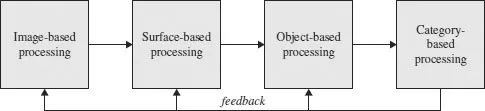
The perception of a scene from a single moment in time is complex. A 3-D world has been flattened into a pair of 2-D images from both eyes that must be reconciled and integrated with information from past experience, previous scenes, and other sources within the brain to reconstruct the third dimension and generate knowledge relevant to the decisions you are making. There are several theories about how the various perceptual processes work, the representations of their inputs and outputs, and how they are organized. But a generally accepted characterization of visual perception is as stages of information processing that begin with the retinal images of the scene as input and end with some kind of conceptual representation of the objects that are used by thought processes for learning, recall, judgment, planning, and reasoning. This information-theoretic approach divides the general processing that takes place in vision into four stages as shown in Fig. 1.2.
Image-based processing includes extracting from the image simple 2-D features, such as edge and line segments or small repeating patterns, and their properties, such as color, size, orientation, shape, and location.
Surface-based processing uses the simple 2-D features and other information to identify the shapes and properties of the surfaces of the objects in the external world we see, and attempts to determine their spatial layout in the external world, including their distance from us. However, many surfaces of objects are hidden because they are behind the surfaces of objects closer to us and cannot be seen.
Object-based processing attempts to combine and group the simpler features and surfaces into the fundamental units of our visual experience: 3-D representations of the objects and their spatial layout in the external world of the scene. The representation of an object is of a geometric shape that includes hidden surfaces, the visible properties of the object that do not require information from experience or general knowledge, and 3-D locations.
Category-based processing identifies these objects as they relate to us by linking them with concepts from things we have seen before or are part of our general understanding of the world, or that are being generated by other systems in the brain such as those processing speech and language. Classification processing uses visible properties of the object against a large number of conceptual patterns stored in our memory to find similar categories of objects. Decision processing selects a category from among the matching categories based either on novelty or uniqueness.
The visual processing just described is a simplification of the process and assumes a static scene, but the world is dynamic. We or the objects in our visual field may be moving. Moment by moment we must act, think, or reflect, and the world around us is full of detail irrelevant to the task at hand. The optical flow, a continuous succession of scenes, is assessed several times a second by small rapid movements of our eyes called saccades that sample the images for what is relevant or interesting. In between, our gaze is fixed for only fractions of a second absorbing some of the detail, for there is far too much information for all of it to be processed. The overload is managed by being selective about where to look, what to take in, and what to ignore. Vision is active, not passive. What we perceive is driven not only by the light that enters our eyes but also by how our attention is focused. Attentional focus can be elicited automatically by distinct visual properties of objects in the scene such as the color of a surface or the thickness of a line, or by directing it deliberately and consciously. We can intentionally focus on specific objects or areas of the scene relevant to the task overtly, through movement of the eyes or head, or covertly within a pair of retinal images, through a mental shift of attention.
In the imagined scenario earlier, by uttering the phrase “follow that red sports car,” your friend defined for you a cognitive task—move toward an object on the exit ramp—and described the particular object that would become the target of a visual query with distinct properties of color and shape to help you perform it. The instruction triggered a series of mostly unconscious events that happened in rapid succession. Based on the goal of looking for red objects along exit ramps and prior knowledge that exit ramps are typically on the outer edge of the highway, the attentional system was cued to focus along the outer edge of the expressway. Eye movements, closely linked with attention, scanned the objects being visually interpreted in this region. The early part of the visual processing pathway was tuned to select objects with red color properties. Red objects within the focal area, assuming there were only a few in sight, were identified almost immediately by the visual system and indexed in a visual memory buffer. These were categorized and considered by later-stage cognitive processes, one at a time, until the red sports car was found.
The goal shifted to tracking and following the sports car. Your eyes fixed on the sports car for a moment and extracted information about its relative distance from you by processing visual cues in the images about depth. These cues included occlusion (the vehicles whose shapes obscure other vehicles are in front), relative size (the longer painted stripes of a lane divider are closer than the shorter ones), location on the image (the closer painted stripes are below the farther painted stripes of a lane divider), and stereopsis (differences in location of the same object in the image from the left and right eye that allowed calculation of the object’s distance from you). The eyes then began a series of saccades targeting the vehicles in front of and next to you to build up the scene around your path as you maneuvered toward the exit.
Every day as you reach for the handle of a cup, scan the spines of books on the shelves of a library or surf the Web, your eyes and brain are engaged in this kind of interaction and activity to parse and interpret the visual field so that you can make decisions and act. Yet you are mostly unaware of the many complex transformations and computations of incoming patterns of light made by the neural cells and networks of your brain required to produce a visual experience of a spatially stable and constant world filled with continuous movement. Replace the scene of the external world with visual forms that can be displayed on computer screens, and the same neural machinery can be used to perceive an environment of digital representations of data to make different kinds of complex decisions. If the visual forms are carefully designed to take advantage of human visual and cognitive systems, then we will more easily find or structure individual marks such as points, lines, symbols, or shapes in different colors and sizes that have been drawn to support various cognitive tasks.
1.3 VISUALIZATION
The scenario in the previous section used visualization—imagining what was not in sight—to introduce the human visual and cognitive systems. The technical fields of scientific, data, and information visualization and visual analytics use the term visualization differently to mean techniques or technologies that can be thought of as visualization tools (Spence, 2001) for making data visible in ways that support analytical reasoning. The essence of this definition includes the person doing the analysis, the user interfaces and graphics that we will call visual forms, and the data. We cannot design effective visualization tools or systems without thinking about the following:
- The analytical tasks, the work environment in which these tasks are done, and the strategies used to perform them
- The content and structure of the visual forms and interaction design of the overall application and systems that will incorporate them
- The data size, structure, and provenance
In the earliest days of computer-supported data visualization, the tasks focused on preparing data graphics for communicati...