For more information visit www.energy.fisherinvestments.com
- English
- ePUB (mobile friendly)
- Available on iOS & Android
eBook - ePub
Fisher Investments on Energy
About this book
The first offering from the Fisher Investments On investing series is a comprehensive guide to the Energy sector. The book can benefit both new and seasoned investors, covering everything from Energy sector basics to specific industry insights to practical investing tactics, including common pitfalls to avoid. Azelton and Teufel demonstrate a method for uncovering performance and risk-management opportunities—and show the readers how they can do it, too. Filled with detailed graphs and tables, unique insight, and practical advice, Fisher Investments on Energy can provide readers with a solid foundation in this sector.
Trusted by 375,005 students
Access to over 1.5 million titles for a fair monthly price.
Study more efficiently using our study tools.
II
NEXT STEPS: ENERGY DETAILS
3
ENERGY SECTOR BREAKDOWN
Now you’ve got the general basics and Energy’s high-level drivers. But keep in mind a sector is really a broad category made of many distinct parts. Any good anthropologist knows “America” is too broad and diverse to understand as a single entity. Instead, one would study regions and states and see how they fit together to understand the whole country. The same is true for the Energy—and any other—sector.
Chapter 1 covered the major industries: Oil & Gas (O&G) and Energy Equipment & Services (EES). But even within those major components, differing sub-industries exist, each with unique characteristics and economic drivers, often interrelated in some way. Before you can make any portfolio decisions, you must understand what a sector looks like and what makes each distinct component tick. This chapter explores the sub-industries and how an investor can form an opinion on each. We’ll answer questions like: What economic drivers are important for each industry? How do they fit with the rest of the sector? How do separate industries work in tandem or against each other?
GLOBAL INDUSTRY CLASSIFICATION STANDARD (GICS)
Before we begin, some definitions. The Global Industry Classification Standard (GICS) is a widely accepted industry framework for classifying firms based on similarities. GICS was developed by MSCI, an independent provider of global indexes and benchmark-related products and services, and Standard & Poor’s, an independent international financial data and investment services company and provider of global equity indexes.
The GICS structure consists of 10 sectors, 24 industry groups, 68 industries, and 154 sub-industries.1 This structure offers four levels of hierarchy, ranging from the most general sector to the most specialized sub-industry:
• Sector
• Industry group
• Industry
• Sub-industry
Let’s start by breaking down the Energy sector into its different components. According to GICS, the Energy sector consists of one industry group (Energy), two industries, and seven sub-industries. Energy’s industries with the corresponding sub-industries are:
Oil, Gas & Consumable Fuels
• Integrated Oil & Gas
• Oil & Gas Exploration & Production
• Oil & Gas Refining & Marketing
• Oil & Gas Storage & Transportation
• Coal & Consumable Fuels
Energy Equipment & Services
• Oil & Gas Drilling
• Oil & Gas Equipment & Services
GLOBAL ENERGY BENCHMARKS
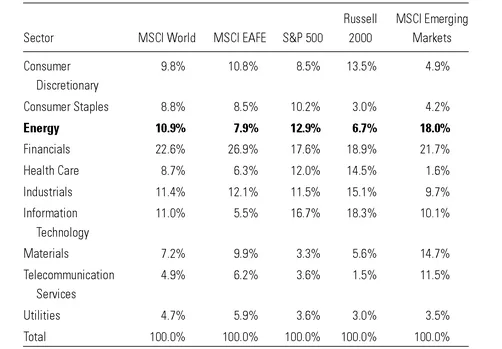
What’s a benchmark? What does it do, and why do you need to select one? A benchmark is your guide for building a stock portfolio. You can use any well-constructed index as a benchmark—examples are in Table 3.1. By studying a benchmark’s (i.e., the index’s) make-up, an investor can assign expected risk and return to make underweight and overweight decisions for each industry. This is just as true for a sector as it is for the broader stock market, and there are many potential Energy sector benchmarks to choose from. (Benchmarks will be further explored in Chapter 7.)
So what does the Energy sector investment universe look like? It depends on the benchmark, so choose carefully! The US Energy sector looks very different from that of Europe, Japan, and the Emerging Markets. Table 3.1 shows major global benchmark indexes and the percentage weight of each sector.
Table 3.1 Energy Benchmark Differences
Source: Thomson Datastream, MSCI, Inc.2 as of 12/31/07.
Common Benchmarks
Commonly used benchmarks include the MSCI World, MSCI EAFE, S&P 500, Russell 2000, and MSCI Emerging Markets. The MSCI World is a market-capitalization weighted index designed to measure the equity market performance of developed markets (encompassing 23 developed markets, including the US). The MSCI EAFE is a market-capitalization weighted index that measures the equity market performance of developed markets excluding the US and Canada. The S&P 500 is a market capitalization weighted index that measures the equity market performance of a basket of 500 stocks that encompass the majority of the US equity universe. The Russell 2000 is a market-capitalization weighted index that measures the equity market performance of the small-cap segment of the US equity universe. Lastly, the MSCI Emerging Markets is a market-capitalization weighted index that measures the equity market performance of emerging markets (encompassing 25 emerging market countries).
The sector weights show the relative importance of each sector in driving overall index performance. While Energy is the second-largest weight in the MSCI Emerging Markets index, it’s only the fourth largest in the MSCI World index (made up of developed nations only). But the sector weights aren’t fixed and can change over time—due to performance differences, additions and deletions of firms to the indexes, and a variety of other factors. For example, Financials wasn’t always the biggest, and for many decades Industrials dominated.
In some countries, Energy is by far the largest sector; while in others, it barely makes up a few percent. Table 3.2 shows the Energy sector percentage weight by country, based on the MSCI World and MSCI Emerging Market indexes. Note the stark differences between developed and emerging market countries. On one extreme, Russia’s stock market is dominated by Energy—mainly state-controlled Gazprom. On the other, Germany has no Energy weight at all.
The sector weight can vary, but so can sub-industry weights—sometimes greatly depending on the chosen benchmark. Table 3.3 shows the weight of each Energy sub-industry within each benchmark. (Columns add up to 100 percent.)
Table 3.2 Energy Weight by Country
Source: Thomson Datastream, MSCI, Inc.3 as of 12/31/07.
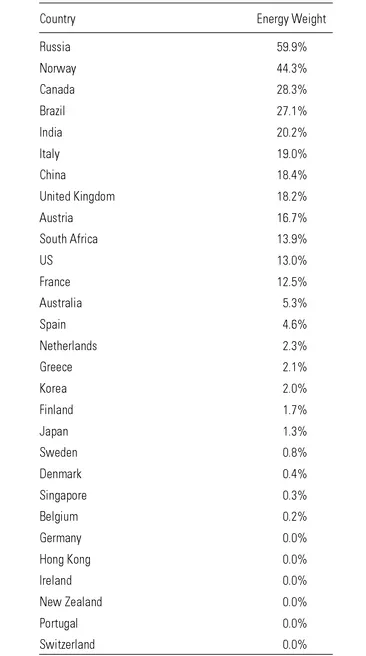
Table 3.3 Energy Sub-Industry Weights
Source: Thomson Datastream, MSCI, Inc.4 as of 12/31/07.
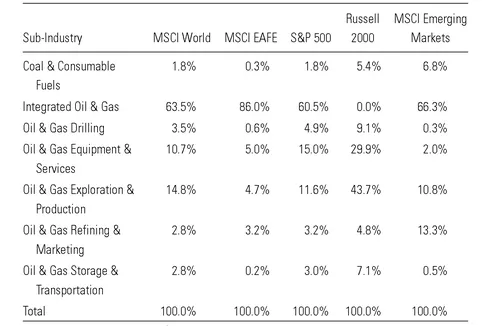
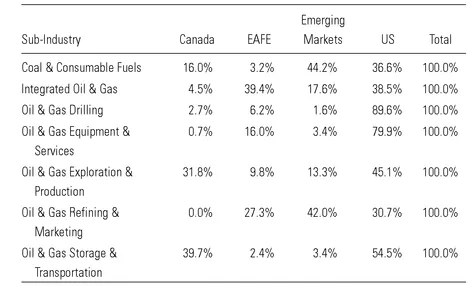
Table 3.4 shows how the global Energy sub-industries are concentrated by region. Using the MSCI All Country World Index (encompassing developed and developing market Energy firms), the table shows how each sub-industry is distributed among regions. It’s important to consider the regions as well, because in a top-down context, local economic and political conditions will have a large impact on sector, industry, and sub-industry performance. For example, if you expect the US will perform well overall in the near term, that bodes well for Oil & Gas Drilling and Oil & Gas Equipment & Services, where most of those companies are located. And how you expect Emerging Markets to perform overall should figure into your expectations for Coal & Consumable Fuels.
The main global Energy benchmarks have some notable differences. But in most, the Integrated Oil & Gas sub-industry is by far the largest sub-industry by market cap (see Table 3.3)—most notably in the MSCI EAFE, where it comprises 86.0 percent of the total Energy sector.
Table 3.4 Energy Sub-Industries by Region
Source: Thomson Datastream, MSCI, Inc.5 as of 12/31/07.
This is because supermajor integrated oil companies (IOCs) all have market caps dwarfing the majority of firms in each index. Previous periods of industry consolidation created the supermajors—familiar firms, like Exxon Mobil, Chevron, Royal Dutch Shell, and BP, characterized by large market caps, geographic diversity, huge reserves, and massive scale. So why are they such a small percentage of the Russell 2000? Because IOCs are generally too large to appear in the small cap Russell 2000 index.
It’s also important to note many of the world’s most significant Integrated Oil & Gas companies are owned by foreign governments and therefore are neither publicly traded nor reflected in stock market indexes. For example, Saudi Aramco, Saudi Arabia’s National Oil Company, is the largest oil company in the world based on production and reserves, but it’s not represented in stock market indexes because it’s entirely state-owned.
Other items to note from the benchmarks: The majority of publicly traded Oil & Gas Exploration & Production firms are in the US. In general, most of these firms explore for and produce oil and gas (mostly natural gas) within North America. While the sub-industry is the second- or third-largest within most major global benchmarks, it’s the largest weight within the small cap Russell 2000 index.
Another US-heavy industry is Energy Equipment & Services, with major energy service firms like Schlumberger and Transocean contributing heavily to the industry’s weight. The industry is growing outside the US but still remains a relatively small weight in most foreign benchmarks. Within Emerging Markets, there are virtually no Energy service firms.
The Oil & Gas Refining & Marketing sub-industry is a relatively small weight in all benchmarks except Emerging Markets, where it’s the second-largest weight. Geographically, most of these firms reside in emerging markets or the US.
Last, the smallest Energy sub-industries are Oil & Gas Storage & Transportation and Coal & Consumable Fuels. Because these firms are relatively smaller in market cap, they only make up a significant weight in the Russell 2000 and Emerging Markets indexes. In the broader indexes, they’re tiny, with little discernable impact. Geographically, Storage & Transportation is almost entirely concentrated in the US and Canada, while Coal & Consumable Fuels is concentrated in emerging markets and the US.
OIL, GAS & CONSUMABLE FUELS INDUSTRY
Once you understand what the benchmarks look like and how they’re comprised, you can analyze the main players and key performance drivers in each sub-industry. And we begin with Oil, Gas, & Consumable Fuels (O&G).
In general, O&G firms explore for, produce, transport, store, and refine oil and natural gas. As mentioned in Chapter 1, these firms make up the integrated process—the upstream, midstream, and downstream activities. By far, these firms as an industry make up the majority of the Energy sector’s market capitalization, including familiar supermajor integrated oil firms like Exxon Mobil, Chevron, Royal Dutch Shell, and BP. This indu...
Table of contents
- FISHER INVESTMENTS PRESS
- Title Page
- Copyright Page
- Foreword
- Preface
- Acknowledgements
- I - GETTING STARTED IN ENERGY
- II - NEXT STEPS: ENERGY DETAILS
- III - THINKING LIKE A PORTFOLIO MANAGER
- Appendix - Energy Sector Resources
- Notes
- Glossary
- About the Authors
- Index
Frequently asked questions
Yes, you can cancel anytime from the Subscription tab in your account settings on the Perlego website. Your subscription will stay active until the end of your current billing period. Learn how to cancel your subscription
No, books cannot be downloaded as external files, such as PDFs, for use outside of Perlego. However, you can download books within the Perlego app for offline reading on mobile or tablet. Learn how to download books offline
Perlego offers two plans: Essential and Complete
- Essential is ideal for learners and professionals who enjoy exploring a wide range of subjects. Access the Essential Library with 800,000+ trusted titles and best-sellers across business, personal growth, and the humanities. Includes unlimited reading time and Standard Read Aloud voice.
- Complete: Perfect for advanced learners and researchers needing full, unrestricted access. Unlock 1.5M+ books across hundreds of subjects, including academic and specialized titles. The Complete Plan also includes advanced features like Premium Read Aloud and Research Assistant.
We are an online textbook subscription service, where you can get access to an entire online library for less than the price of a single book per month. With over 1.5 million books across 990+ topics, we’ve got you covered! Learn about our mission
Look out for the read-aloud symbol on your next book to see if you can listen to it. The read-aloud tool reads text aloud for you, highlighting the text as it is being read. You can pause it, speed it up and slow it down. Learn more about Read Aloud
Yes! You can use the Perlego app on both iOS and Android devices to read anytime, anywhere — even offline. Perfect for commutes or when you’re on the go.
Please note we cannot support devices running on iOS 13 and Android 7 or earlier. Learn more about using the app
Please note we cannot support devices running on iOS 13 and Android 7 or earlier. Learn more about using the app
Yes, you can access Fisher Investments on Energy by Andrew Teufel,Aaron Azelton in PDF and/or ePUB format, as well as other popular books in Business & Energy Industry. We have over 1.5 million books available in our catalogue for you to explore.