The Analysis of Covariance and Alternatives
eBook - ePub

The Analysis of Covariance and Alternatives

Statistical Methods for Experiments, Quasi-Experiments, and Single-Case Studies

  1. English
  2. ePUB (mobile friendly)
  3. Available on iOS & Android
eBook - ePub

The Analysis of Covariance and Alternatives

Statistical Methods for Experiments, Quasi-Experiments, and Single-Case Studies

About this book

A complete guide to cutting-edge techniques and best practices for applying covariance analysis methods

The Second Edition of Analysis of Covariance and Alternatives sheds new light on its topic, offering in-depth discussions of underlying assumptions, comprehensive interpretations of results, and comparisons of distinct approaches. The book has been extensively revised and updated to feature an in-depth review of prerequisites and the latest developments in the field.

The author begins with a discussion of essential topics relating to experimental design and analysis, including analysis of variance, multiple regression, effect size measures and newly developed methods of communicating statistical results. Subsequent chapters feature newly added methods for the analysis of experimentswith orderedtreatments, including two parametric and nonparametric monotone analyses as well as approaches based on the robust general linear model and reversed ordinal logistic regression. Four groundbreaking chapters on single-case designs introduce powerful new analyses for simple and complex single-case experiments. This Second Edition also features coverage of advanced methods including:

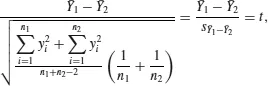
  • Simple and multiple analysis of covariance using both the Fisher approach and the general linear model approach
  • Methods to manage assumption departures, including heterogeneous slopes, nonlinear functions, dichotomous dependent variables, and covariates affected by treatments
  • Power analysis and the application of covariance analysis to randomized-block designs, two-factor designs, pre- and post-test designs, and multiple dependent variable designs
  • Measurement error correction and propensity score methods developed for quasi-experiments, observational studies, and uncontrolled clinical trials

Thoroughly updated to reflect the growing nature of the field, Analysis of Covariance and Alternatives is a suitable book for behavioral and medical scineces courses on design of experiments and regression and the upper-undergraduate and graduate levels. It also serves as an authoritative reference work for researchers and academics in the fields of medicine, clinical trials, epidemiology, public health, sociology, and engineering.

Frequently asked questions

Yes, you can cancel anytime from the Subscription tab in your account settings on the Perlego website. Your subscription will stay active until the end of your current billing period. Learn how to cancel your subscription.
No, books cannot be downloaded as external files, such as PDFs, for use outside of Perlego. However, you can download books within the Perlego app for offline reading on mobile or tablet. Learn more here.
Perlego offers two plans: Essential and Complete
  • Essential is ideal for learners and professionals who enjoy exploring a wide range of subjects. Access the Essential Library with 800,000+ trusted titles and best-sellers across business, personal growth, and the humanities. Includes unlimited reading time and Standard Read Aloud voice.
  • Complete: Perfect for advanced learners and researchers needing full, unrestricted access. Unlock 1.4M+ books across hundreds of subjects, including academic and specialized titles. The Complete Plan also includes advanced features like Premium Read Aloud and Research Assistant.
Both plans are available with monthly, semester, or annual billing cycles.
We are an online textbook subscription service, where you can get access to an entire online library for less than the price of a single book per month. With over 1 million books across 1000+ topics, we’ve got you covered! Learn more here.
Look out for the read-aloud symbol on your next book to see if you can listen to it. The read-aloud tool reads text aloud for you, highlighting the text as it is being read. You can pause it, speed it up and slow it down. Learn more here.
Yes! You can use the Perlego app on both iOS or Android devices to read anytime, anywhere — even offline. Perfect for commutes or when you’re on the go.
Please note we cannot support devices running on iOS 13 and Android 7 or earlier. Learn more about using the app.
Yes, you can access The Analysis of Covariance and Alternatives by Bradley Huitema in PDF and/or ePUB format, as well as other popular books in Mathematics & Probability & Statistics. We have over one million books available in our catalogue for you to explore.

Information

Publisher
Wiley
Year
2011
Print ISBN
9780471748960
eBook ISBN
9781118067468
PART I
Basic Experimental Design and Analysis
CHAPTER 1
Review of Basic Statistical Methods
1.1 INTRODUCTION
Statistical methods are often subsumed under the general headings “descriptive” and “inferential.” The emphasis in behavioral and medical science statistics books is frequently on the inferential rather than the descriptive aspects of statistics. This emphasis sometimes occurs because descriptive statistics such as means, variances, standard deviations, correlation coefficients, regression coefficients, and odds ratios can be described and explained in relatively few chapters. The foundations of inferential statistics generally require longer explanations, a higher level of abstract thinking, and more complex formulas. Associated with the large amount of space devoted to inference is a failure on the part of many professionals to appreciate that description is usually the most informative aspect of a statistical analysis.
A perusal of many current journals reveals that the overemphasis on inference (especially tests of significance) and the underemphasis on simple description is widespread; the inferential tail is frequently allowed to wag the descriptive dog. Descriptive statistics are not only underemphasized, they are sometimes completely ignored. One frequently encounters research outcomes reported in terms of only probability values or statements of “significant” or “nonsignificant” with no mention of the size of the difference (e.g., a difference between sample means) associated with the inferential results. The sources of this perversity go beyond statistical training; editorial policies of journals, demands of funding agencies, and criteria established by governmental agencies are also involved. An exploration of the development of this problem is interesting but tangential to this review; it will not be pursued here.
The remaining sections of this chapter begin with a review of conventional hypothesis testing (including elementary statistical decision theory) and interval estimation procedures for the simple randomized two-group experiment. Issues associated with standardized effect sizes, measures of association, generalization of results, and the control of nuisance variation are also presented.
1.2 ELEMENTARY STATISTICAL INFERENCE
Research workers generally employ inferential statistics in dealing with the problem of generalizing results based on sample data to the populations from which the subjects were selected. Suppose we (1) randomly select N mentally retarded patients from a Michigan institution, (2) randomly assign these patients to treatments 1 and 2, (3) apply the treatments, and (4) obtain an outcome measure Y on each patient. A useful descriptive measure of the differential effectiveness of the two treatments is the difference between the two sample means. This difference is an unbiased point estimate of the difference between the corresponding population means.
If it turns out that the sample mean difference is large enough to be of clinical or practical importance, the investigator may want to make a statement about the difference between the unknown population means μ1 and μ2. Population mean μ1 is the mean score that would have been obtained if treatment 1 had been administered to all mentally retarded patients in the whole institutional population. Population mean μ2 is the mean score that would have been obtained if instead the second treatment had been administered to the whole institutional population. Inferential tests and confidence intervals are widely used to evaluate whether there are sufficient sample data to state that there is a difference between unknown population means and (in the case of the confidence interval) to provide an interval within which it can be argued that the population mean difference will be found. A summary of hypothesis testing and confidence interval methods for the two-group design is presented in Table 1.1. An understanding of the conceptual foundation for these methods requires that several crucial distinctions be made among different types of measures and distributions; these are reviewed next.
Table 1.1 Summary of the Computation and Interpretation of the Independent Samples t-Test and 95% Confidence Interval for the Case of a Randomized Two-Group Experiment
A. Hypothesis Test
Null hypothesis: H0:
inline
.
Test: Independent samples t (assume homogeneous population variances):
Unnumbered Display Equation
where
inline
are the within-group sum of squared deviation (centered) scores for groups 1 and 2, respectively;
inline
are sample sizes associated with groups 1 and 2; and
inline
is the estimate of the standard error of the difference.
When the t-ratio is obtained from sample data it is called the obtained value of t (denoted as tobt). After it is computed a decision rule is invoked in order to decide whether to reject the null hypothesis. Two forms of decision rules are described below; before either one can be used it is necessary to specify the level of α. Recall that the level of significance α is set before the experiment is carried out. If a directional (one-tailed) test is desired, the level of α may be denoted as α1. If a nondirectional (two-tailed) test is involved, then the level of alpha may be denoted as α2.
Decision rule for a nondirectional test using t. If the absolute value of tobt is ≥ tcv (where tcv is the critical value), then reject H0; otherwise retain. The critical value of t is often based on α2 set at .05; the degrees of freedom = N − 2 (where N = n1 + n2).
Decision rule for a nondirectional test using the p-value. Because most current statistics computer programs provide p-values in addition to obtained t-values, the modern approach is to simply inspect the p-value and compare it with the level of α that has been specified. The decision rule for a nondirectional test is as follows: if the p-value is ≤ α2, reject H0; otherwise retain.
B. Confidence Interval
In the case of a simple two-group independent samples experiment the relevant 95% confidence interval is computed as follows:
Unnumbered Display Equation
where
inline
is the estimate of the standard error of the difference; and
inline
is the critical value of the t statistic bas...

Table of contents

  1. Cover
  2. Series
  3. Title Page
  4. Copyright
  5. Dedication
  6. Preface
  7. PART I: Basic Experimental Design and Analysis
  8. PART II: Essentials of Regression Analysis
  9. PART III: Essentials of Simple and Multiple ANCOVA
  10. PART IV: Alternatives for Assumption Departures
  11. PART V: Single-Case Designs
  12. PART VI: ANCOVA Extensions
  13. PART VII: Quasi-Experiments and Misconceptions
  14. Appendix: Statistical Tables
  15. References
  16. Index