![]()
1
Introduction
1.1 Favorable Betting Scenarios
The buy-and-hold strategies under efficient market dogma have shifted toward active trading strategies under adaptive market alternatives. Microeconomics appears to be back. It would be better if, as Keynes said, markets were not the by-product of a casino. But, in fact, they are.
In light of the greatest downturn since the Great Depression, the shift to active trading is not without critics. Under Saint Joan's banner, French President Sarkozy has taken steps to instill moral values in the global market economy by urging policymakers to consider fresh ways of combating financial short-termism1 (Hall, 1/3/09). Perhaps Mr. Sarkozy has taken a perverse view of Keynes' dictum that economics is a moral and not a natural science.
The recessionary angst of late 2008 saw many favorable betting scenarios in financial and sports gambling markets. Attractive bets included: establishing short positions on Goldman Sachs shares during November and betting on the Los Angeles Lakers (favored by 3 points) in their Christmas Day rematch with the Boston Celtics. (The Celtics embarrassed the Lakers in the previous National Basketball Association championship series). The attractiveness of each bet depended on the effectiveness of the gambler's forecasting models—models that are assumed based on public information.
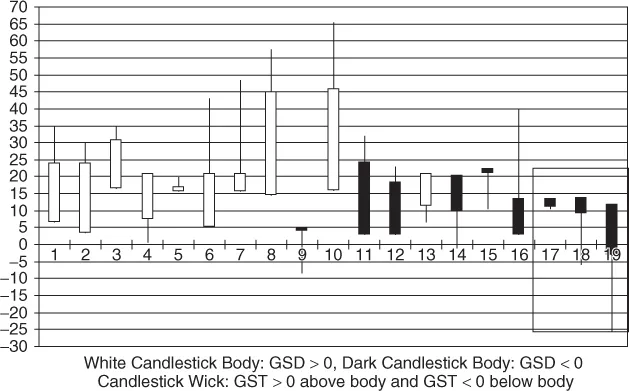
It has been argued that profitable modeling forecasts tend to favor the sports gambling markets since they are accommodated by greater regulation and surveillance, considerably less opacity, and public point spreads that reflect the gambling public's expectations. For example, the New England Patriots' loss to the New York Giants in the 2008 Super Bowl was an outcome that superseded the New York Jets' upset win over the Baltimore Colts in the 1969 Super Bowl. The Patriots were prohibitive 12-point favorites; the bookmakers' line on total points scored was 53.5. Relative to the lines on the difference and total points scored, the Patriots had vastly overperformed throughout the first half of the season, then underperformed but kept winning until the finale (see Figure 1.2.2). New England had clearly peaked by midseason.
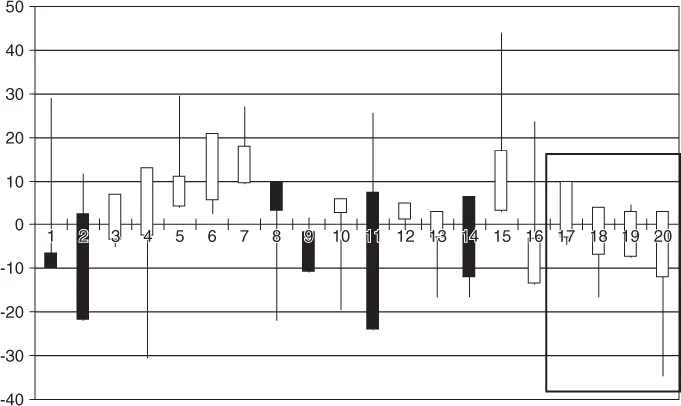
In contrast, the Giants jelled in the second half of the season and peaked during the play-offs (see Figure 1.2.3). In the finale, the Giants won 17–14, an outcome that was easily amenable to effective forecasting; see Table 1.1.1 and the modeling procedure described in Section 10.2.
Table 1.1.1 Super Bowl 2008: NE Patriots vs. NY Giants + 12a
| Patriots to win by more than 7 points | $2.01 to 1 | 0.33 |
| Game decided by at most 7 points | $13.3 to 1 | 0.11 |
| Giants to win by more than 7 points | $0.79 to 1 | 0.56 |
Relative to the line, the Giants' expected winning margin of 3.4 points was a far more realistic estimate of the outcome. (See Section 11.2 for the calculation of the expected winning margin.) However, whether or not the line is realistic, there are always two groups of winners—those covering2 the bets and those betting on the winning side of the line—and one group of losers—those betting on the losing side of the line. Those covering the bets charge a commission per bet and are always the winners as long as the line splits the money wagered (i.e., losing bets pay off the winning bets after commissions). Thus, a bookmaker's line is simply a measure of the gambling public's expectation of a game's outcome—regardless of whether or not that expectation is realistic.
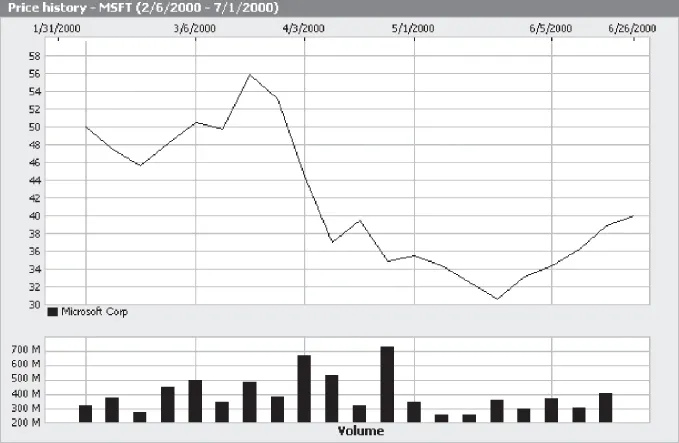
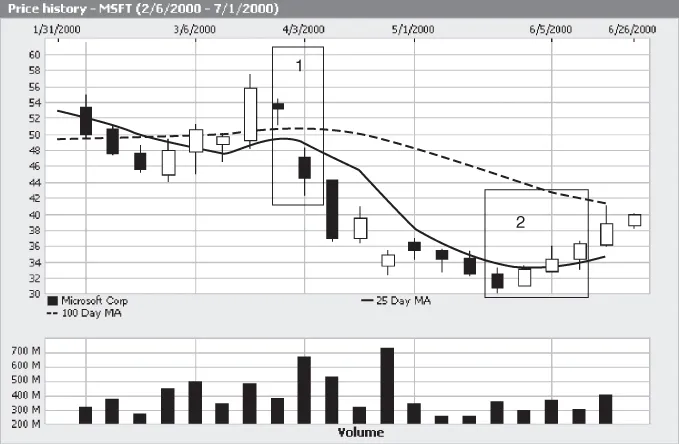
A financial market analogy to Table 1.1.1 is illustrated in terms of Microsoft's (stock symbol: MSFT) price movements during 1999–2000, a volatile period during final inflation and deflation of the NASDAQ bubble. From 3/27/00 to 4/3/00, the MSFT closing price dropped from $53.13/share to $44.53/share. Figure 1.1.1 presents weekly price changes and volumes through the January–June 2000 period, and Figure 1.1.3 presents these changes in terms of a candlestick chart (see Section 5.1 for detailed discussions).
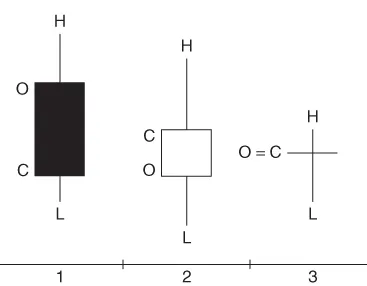
In Figure 1.1.3, each week in Figure 1.1.1 is represented by a candlestick that depicts four summary prices for MSFT: the opening price (O), the high (H), the low (L), and the closing price (C) for the week. A candlestick is composed of a body and a wick that extends above and below the body. The body is white if C > O and dark if O > C. The maximum (minimum) of the wick is the high (low) for the week; see Figure 1.1.2 for an illustration of three hypothetical candlesticks. The lower portion of Figure 1.1.3 presents the 25- and 100-day moving averages for C (where five trading days correspond to one week). The moving averages are based on successive days prior to each weekly candlestick.
A short-term modeling objective was to forecast the change in the closing price from 3/27/00 to 4/3/00; see box 1 in Figure 1.1.1. Adaptive drift modeling led to the results in Table 1.1.2 (see Chapter 9). The forecast correctly projected a significant drop in price, although the actual loss was underestimated relative to the expected loss. The same modeling procedures were used to forecast losses correctly through mid-May and gains in the rebound that followed; see box 2 in Figure 1.1.1.
Table 1.1.2 Odds on D(MSFT, t), the Change in the Closing Price per Share of Microsoft from 3/27/00 to 4/5/00a
| > $6 | $19.0 to 1 | 0.05 |
| [$6, $2) | $11.5 to 1 | 0.08 |
| [−$2, $2] | $7.33 to 1 | 0.12 |
| (−$2, −$6] | $3.00 to 1 | 0.25 |
| < − $6 | $1.04 to 1 | 0.49 |
1.2 Gambling Shocks
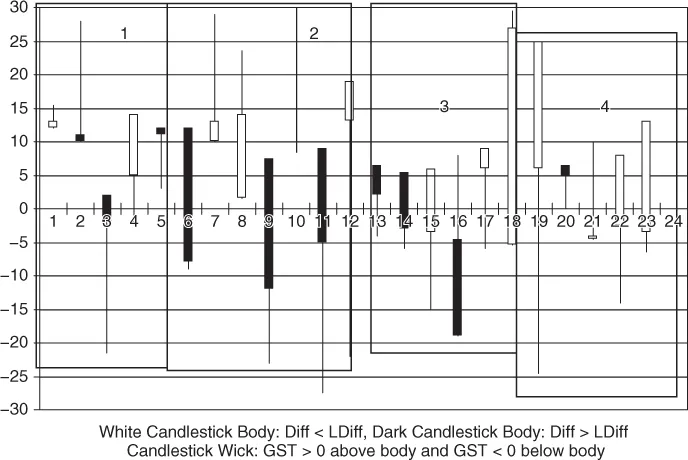
A gambling shock (GS) is defined as the difference between the game outcome and the line. For example, if the line on the difference favors the Patriots by 12 points and they lose by 3 points, GSdifference(NE) = GSD(NE) = − 3 − (12) = − 15. If the line on the total points scored in the Giants–Patriots game is 51 and the total points scored is 31, then GStotal(NE) = GStotal(NYG) = GST( * ) = 31 − 51 = − 20. Larger values of |GSD| and/or |GST| for a particular team generally affect that team's subsequent performance or performances in that they may reflect the effects of motivation, injuries, personnel problems, and so on—all of which translate into physiological, psychological, and sociological variables.
When, for example, the Giants suffered through two embarrassing losses to the Dallas Cowboys during the 2007–2008 regular season, the likelihood of a Giants' upset win against Dallas in the play-offs was exceptionally high (especially in view of the Giants late-season performances). In fact, when the Giants lost a game throughout the regular season, they usually won their next game (as shown in Figure 1.2.3).
When there are marked differences in player talent between opposing teams, the GS may act as a surrogate for fans and teams in the evaluation of team and player performances. The home team fans may take consolation when their underdog team loses by less than the spread—especially if they've bet on their team.
We play hard and cover. We lead the league in covering the point spread.
(Hubie Brown, coach of the last-place New York Knicks, Sports Illustrated, 1986)
Figure 1.2.1 depicts game outcomes and accompanying gambling shocks for the 23 Los Angeles Lakers' play-off games leading to their 2008–2009 National Basketball Association (NBA) title. The Lakers won in five games against Utah, seven against Houston, six against Denver, and then five in the finale against Orlando. White bodies denote games in which the Lakers beat the line on the difference. The minimum value of the white body is the line on the difference for Lakers, and the maximum of a white body is the Lakers' winning/losing margin. Dark bodies denote games in which the Lakers did not beat the line; that is, the maximum value of a dark body is the line on the difference, and the minimum value of a dark body is the winning or losing margin. A white (dark) body indicates that the Lakers overperformed (underperformed) relative to the line on the difference. The size (magnitude) of the body reflects (equals) the size of the gambling shock on the difference for the Lakers. An observed differe...