![]()
Chapter One
Fasten Your Seat Belt
Sideways Markets Are Here to Stay
Get ready for a great roller-coaster ride in the markets. For the next decade or so the Dow Jones Industrial Average and the S&P 500 index will likely do what they did over the preceding decade: go up and down, setting all-time highs and multiyear lows along the way. But at the end of the ride, index and buy-and-hold stock investors, having experienced ups and downs and swings akin to those on an amusement park ride, will find themselves pretty much back where they started. This is all well and fine for visitors to Six Flags, but not really what most of us want for our investments and savings.
The length, the velocity, and the twists of the ride are yet to be written by history, but the flat long-term trajectory has been ordained by the 18-year bull market that ended in 2000. Using history as a guide, until about 2020 (give or take a few years) the U.S. stock market will likely continue to stagnate. Welcome to the sideways market!
Take a Trip to the Zoo
When we think of market direction we think in binary terms: bull—going up, and bear—declining. But what about markets that go nowhere over time? They are known as sideways markets and they look quite different from bear markets, although the distinction is seldom made. All long-term markets of the last century, with one exception, were either bull or sideways.a Since investors are used to associating animals with the direction of the market, I suggest a moniker for the sideways market: the cowardly lion, whose bursts of occasional bravery lead to stock appreciation but are ultimately overrun by fear that leads to a descent.
We also split trends by how long they last. A secular market describes a state that lasts more than five years, perhaps taking place only once in a generation. A cyclical state is a significantly shorter market cycle that lasts a few months to a few years. When I discuss secular bull, bear, or sideways markets, I’ll refer to them just as bull, bear, and sideways markets. I’ll use the word cyclical when referencing cyclical markets.
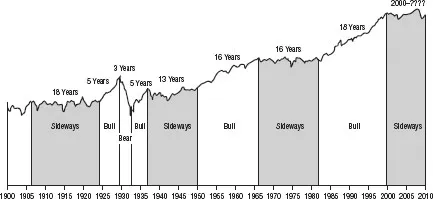
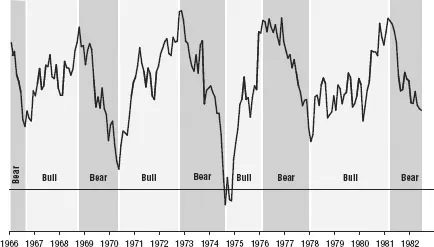
During the twentieth century, almost every protracted bull market lasted about a decade and a half or so and was followed by a cowardly lion market that lasted just as long. For evidence, see Exhibit 1.1. The only exception was the Great Depression, where the bull market was followed by a bear market. Sideways and bear markets are radically different in nature and your investment strategies need to be radically different, too.
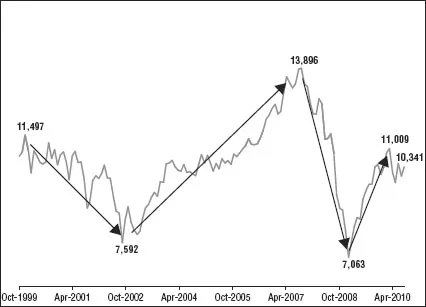
Let’s look at a really long-term picture of the market. In Exhibit 1.1, we see that our current sideways market started on the heels of the 1982–2000 secular bull market. Since then, as you see in Exhibit 1.2, we have had a two-and-a-half-year cyclical (short-term) bear market, followed by a four-year cyclical bull market and then an all too familiar 50 percent decline that has been followed by a nice bounce since March 2009. Altogether, the market hasn’t gone anywhere in more than 10 years. If you are a long-term investor in an index fund or buying and holding, you are pretty much where you started 10 years ago.
It Takes (At Least) Two
Ask an investor what the stock market will do over the next decade and he’ll tell you his expectations for the economy and earnings growth and then turn them into a projection for the market. This kind of thinking only looks at half of the equation that explains stock market (and individual stock) returns, while ignoring a very important variable that is responsible for a significant part of stock returns: the price-to-earnings (P/E) ratio. The P/E tells us what investors are paying for a dollar of earnings: A $15 stock of a company that earned $1 last year is trading at a P/E of 15.
Stock prices in the long run (not minutes or days, but years) are driven by two factors: earnings growth and changes in valuation (P/E ratio). Add a return from dividends, and you’ve captured all the variables responsible for the total return from stocks. The following equationb (don’t worry, this is the only one in the entire book) illustrates this:
Stock’s total return = Earnings growth/decline + change in P/E + dividend yield
I hate the use of formulas in investing, as they usually do more harm than good (especially the ones with fancy Greek symbols), but this one is actually helpful and not dangerous.
I dug up economic and stock market data for the last 100 years, sliced it and diced it in different ways, and came to only one possible conclusion: Performance of the economy and earnings growth did not vary much between cowardly lion and bull markets. Although in the short run the rates of economic and earnings growth were responsible for (cyclical) swings in the market, in the longer run, as long as we had an average economy (not super-good or super-bad), the animal in charge of the market was either the bull or the cowardly lion.
Feeling Skeptical? It’s Okay
If someone else was making a prediction that markets will be sideways for another decade and he was relying on past data to make this disturbing claim, I’d be skeptical. After all, the past has passed and the future may be different. If you are feeling a bit wary about what I’ve said so far, you have a right to be, but hang on as I present the case. As you’ll see, this prediction is less wacky than it appears at first.
I am an investor. I live and breathe stocks and have little patience for theoretical discussions. Thus, this is not a theoretical little tome. It is a practical guide to value investing in sideways markets. In Chapters 2 and 3 I explain what sideways markets are and how they will impact us. Then I put you in the shoes of a value investor through the story of Tevye—the milkman, farmer, and value investor. Finally, I introduce you to the framework for guiding your stock analysis that takes into account the lingering effects of the Great Recession, the financial crisis of 2008–2009, and the coming impact of the economic conditions in Japan and China so that you will be able to steer your portfolio safely and steadily in the face of continued uncertainties.
![]()
Chapter Two
A Sideways View of the World
What Happens in a Sideways Market
Most people (myself included) find discussions about stock markets a bit esoteric; for us, it is a lot easier to relate to individual stocks. Since a stock market is just a collection of individual stocks, let’s take a look at a very typical sideways stock first: Wal-Mart. It will give us insight into what takes place in a sideways market (see Exhibit 2.1). Though its shareholders experienced plenty of volatility over the past 10 years, the stock has gone nowhere—it fell prey to a cowardly lion.
Over the last decade Wal-Mart’s earnings almost tripled from $1.25 per share to $3.42, growing at an impressive rate of 11.8 percent a year. This doesn’t look like a stagnant, failing company; in fact, it’s quite an impressive performance for a company whose sales are approaching half a trillion dollars. However, its stock chart led you to believe otherwise. The culprit responsible for this unexciting performance was valuation—the P/E—which declined from 45 to 13.7, or about 12.4 percent a year. The stock has not gone anywhere, as all the benefits from earnings growth were canceled out by a declining P/E. Even though revenues more than doubled and earnings almost tripled, all of the return for shareholders of this terrific company came from dividends, which did not amount to much.
This is exactly what we see in the broader stock market, which is comprised of a large number of companies whose stock prices have gone and will go nowhere in a sideways market.
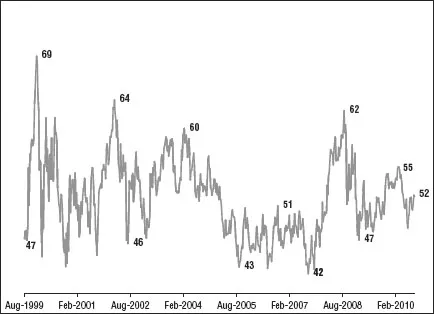
Let’s zero in on the last sideways market the United States saw, from 1966 to 1982. Earnings grew about 6.6 percent a year, while P/Es declined 4.2 percent; thus stock prices went up roughly 2.2 percent a year. As you can see in Exhibit 2.2, a secular sideways market is full of little (cyclical) bull and bear markets. The 1966–1982 market had five cyclical bull and five cyclical bear markets.
This is what happens in sideways markets: Two forces work against each other. The benefits of earnings growth are wiped out by P/E compression (the staple of sideways markets); stocks don’t go anywhere for a long time, with plenty of (cyclical) volatility, while you patiently collect your dividends, which are meager in today’s environment.
A quick glimpse at the current sideways market shows a similar picture: P/Es declined from 30 to 19, a rate of 4.6 percent a year, while earnings grew 2.4 percent. This explains why we are now pretty much where we were in 2000.
Bulls, Bears, and Cowardly Lions—Oh My
Exhibit 2.3 describes economic conditions and starting P/Es required for each market cycle. Historically, earnings growth, though it fluctuated in the short term, was very similar to the growth of the economy (GDP), averaging about 5 percent a year. If the market’s P/E did not change and always remained at its average of 15, then we would not have bull or sideways market cycles—we’d have no secular market cycles, period! Stock prices would go up with earnings growth, which would fluctuate due to normal economic cyclicality but would average about 5 percent, and investors would collect an additional approximately 4 percent in dividends. That is what would happen in a utopian world where people are completely rational and unemotional. But as Yoda might have put it, the utopian world is not, and people rational are not.
Exhibit 2.3 Economic Growth + Starting P/E = ?
| Market | Economic Growth | Starting Valuation (P/E) |
| Bull | Average | Low |
| Sideways | Average | High |
| Bear | Bad | High |
The P/E’s journey from one extreme to the other is completely responsible for sideways and bull markets: P/E’s ascent from low to high caused bull markets, and P/E’s descent from high to low was responsible for the roller-coaster ride of sideways markets.
Bear markets happened when you had two conditions in place, a high starting P/E and prolonged economic distress; together they are a lethal combination. High P/Es reflect high investor expectations for the economy. Economic blues such as runaway inflation, severe deflation, declining or stagnating earnings, or a combination of these things sour these high expectations. Instead of an above-average economy, investors wake up to an economy that is below average. Presto, a bear market has ...