Would you like to discover one of the most well-known price Analysis Technique used by professional traders and companies? Would you like to learn and understand the market and its financial tools with a simple glimpse? When traders realize the potentialities of this technique, their work improves. They become more aware of the market signs and acquire a stronger psychological calmness. To sum up, they can get top results because they learn to understand the market trading by a simple and accessible guide! Stop wasting your time and start NOW to discover how you can start a trading activity by the Japanese candlesticks.
- English
- ePUB (mobile friendly)
- Available on iOS & Android
eBook - ePub
An easy approach to japanese candlesticks
About this book
Trusted by 375,005 students
Access to over 1.5 million titles for a fair monthly price.
Study more efficiently using our study tools.
Information
Basic information
The first thing to learn is to understand how a Japanese candlestick can take shape.
The most evident difference between a traditional financial chart and a Japanese candlestick is about how they can be observed by traders. A candlestick is a price line divided into many single bars, which are similar to a candle.
Each of them takes shape and develops according to two factors:
The temporal sample with which the construction of a price chart is planned;
The volatility measure that the financial tool has shown while it is observed.
These points immediately highlight an interesting norm: the Japanese candlesticks can visually offer a different representation of the price volatility, which is a factor that facilitates enormously the task to understand the markets. The easiest way to notice this difference consists in comparing the same financial tool according to the graphic representation rules.
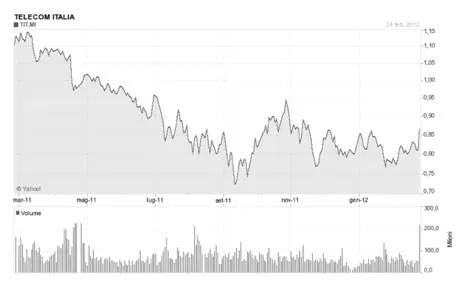
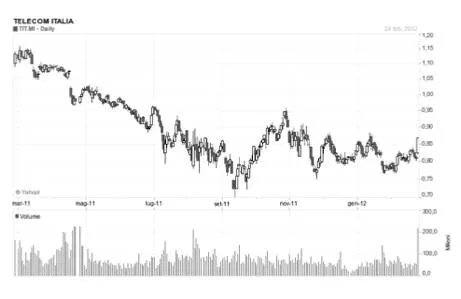
All the graphs that we usually know, which come from the specialized press and the main financial media, are the so-called ‘linear type’.
In the image below, you can observe that the price course is shown as a line that moves with the passage of time.
In this kind of graph, which is an example of a bear trend, you can literally see and understand what a trend course is:
The most evident difference between a traditional financial chart and a Japanese candlestick is about how they can be observed by traders. A candlestick is a price line divided into many single bars, which are similar to a candle.
Each of them takes shape and develops according to two factors:
The temporal sample with which the construction of a price chart is planned;
The volatility measure that the financial tool has shown while it is observed.
These points immediately highlight an interesting norm: the Japanese candlesticks can visually offer a different representation of the price volatility, which is a factor that facilitates enormously the task to understand the markets. The easiest way to notice this difference consists in comparing the same financial tool according to the graphic representation rules.
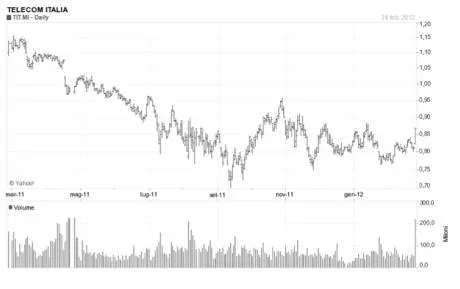
All the graphs that we usually know, which come from the specialized press and the main financial media, are the so-called ‘linear type’.
In the image below, you can observe that the price course is shown as a line that moves with the passage of time.
In this kind of graph, which is an example of a bear trend, you can literally see and understand what a trend course is:
Here is an example:
On the left side of the bar, there is a hyphen showing the opening price, while on the right one it is possible to observe the closing price. We see through an enlargement the details of what we have just stated:
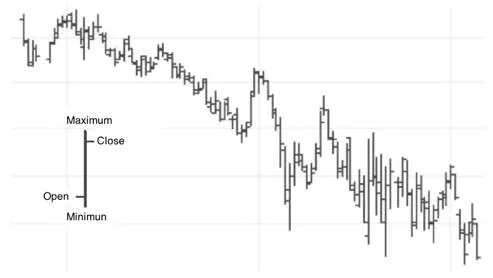
The dimension of the peaks and dips of the day allows getting precious information if you want to understand the course of the market and the price struggle between buyers and sellers.
However, thanks to the Japanese candlesticks, we can be offered an even more interesting graphic visualization:
Please, observe how the course dimension of the prices changes, according to their representation, which is common among candlesticks.
Apart from the measure of the (linear) trend and the openings and closings comprehension, the bar color immediately offers us a visual relation as far as the purchases or sales predominance is concerned.
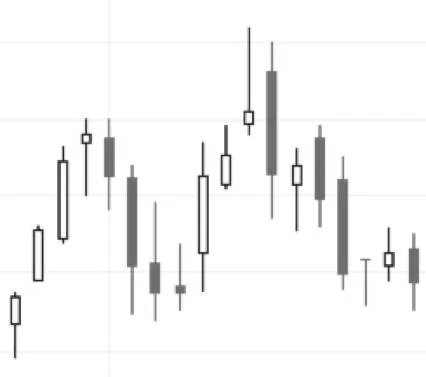
What really makes interesting this representation is the fact that the candlesticks set between the trend peaks and dips can offer some valid and anticipating signs about the possible continuation or investment of the price trend. The Japanese candlesticks research will let us anticipate so many changes that we can use them profitably during our trading activity.
The Candlesticks Formation
The distinctions among the different price graphic representation rules of a financial tool that we have seen above have been useful to underline the operative potentialities of the Japanese candlesticks over the most traditional charts.
Now it is necessary to put another foot forward and learn how prices can take form through the candlesticks technique. This step is fundamental to understand a graph better, as well as to recognize easily the patterns and the continuation and investment schemes that will be studied in depth in the following pages.
As we have already done for the bar graph, we can now see an enlargement of some Japanese candlesticks. The picture below represents two typical price candles. The first one, which is underlined in dark, is called ‘bear candlestick’. The second one, whose body is white, represents a ‘bull candlestick’:
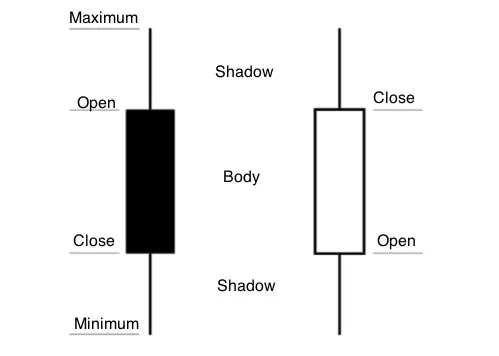
Another interesting data we can observe in these candlesticks is represented by the so-called ‘shadows...
Table of contents
- Cover
- AN EASY APPROACH TO JAPANESE CANDLESTICKS
- Colophon
- Table of contents
- Disclaimer
- Introduction
- A First Look at the Japanese Candlesticks
- Brief Candlesticks History
- Basic information
- The Candlesticks Formation
- Candlesticks Typologies
- The Shadows Candlesticks
- The Price Patterns
- The Morning Star and the Evening Star
- The Hammer and the Hanging Man
- The Shooting Star and the Inverted Hammer
- The Engulfing Pattern
- The Dark Cloud Cover and the Piercing Line
- The Harami Pattern
- The Tweezer Top and the Tweezer Bottom
- The Three White Soldiers and the Three Black Crows
- Gaps and Candlestick Trading
- The Continuation Patterns
- The Three Methods Pattern
- The Thrusting Line
- The Japanese Candlesticks Graph
- Some Final Suggestions
- Conclusion
Frequently asked questions
Yes, you can cancel anytime from the Subscription tab in your account settings on the Perlego website. Your subscription will stay active until the end of your current billing period. Learn how to cancel your subscription
No, books cannot be downloaded as external files, such as PDFs, for use outside of Perlego. However, you can download books within the Perlego app for offline reading on mobile or tablet. Learn how to download books offline
Perlego offers two plans: Essential and Complete
- Essential is ideal for learners and professionals who enjoy exploring a wide range of subjects. Access the Essential Library with 800,000+ trusted titles and best-sellers across business, personal growth, and the humanities. Includes unlimited reading time and Standard Read Aloud voice.
- Complete: Perfect for advanced learners and researchers needing full, unrestricted access. Unlock 1.5M+ books across hundreds of subjects, including academic and specialized titles. The Complete Plan also includes advanced features like Premium Read Aloud and Research Assistant.
We are an online textbook subscription service, where you can get access to an entire online library for less than the price of a single book per month. With over 1.5 million books across 990+ topics, we’ve got you covered! Learn about our mission
Look out for the read-aloud symbol on your next book to see if you can listen to it. The read-aloud tool reads text aloud for you, highlighting the text as it is being read. You can pause it, speed it up and slow it down. Learn more about Read Aloud
Yes! You can use the Perlego app on both iOS and Android devices to read anytime, anywhere — even offline. Perfect for commutes or when you’re on the go.
Please note we cannot support devices running on iOS 13 and Android 7 or earlier. Learn more about using the app
Please note we cannot support devices running on iOS 13 and Android 7 or earlier. Learn more about using the app
Yes, you can access An easy approach to japanese candlesticks by Stefano Calicchio in PDF and/or ePUB format, as well as other popular books in Business & Finance. We have over 1.5 million books available in our catalogue for you to explore.