A deconstruction of the neoliberal placations about global capitalism, exposing the inequalities of global poverty
“We’re making headway on global poverty,” trills Bill Gates. “Decline of Global Extreme Poverty Continues,” reports the World Bank. “How did the global poverty rate halve in 20 years?” inquires The Economist.
Seth Donnelly answers: “It didn’t!” In fact, according to Donnelly, virtually nothing about these glad tidings proclaiming plummeting global poverty rates is true. It’s just that trend-setting neoliberal experts and institutions need us to believe that global capitalism, now unfettered in the wake of the Cold War and bolstered by Information Technology, has ushered in a new phase of international human prosperity.
This short book deconstructs the assumption that global poverty has fallen dramatically, and lays bare the spurious methods of poverty measurement and data on which the dominant prosperity narrative depends. Here is carefully researched documentation that global poverty—and the inequalities and misery that flourish within it—remains massive, afflicting the majority of the world’s population. Donnelly goes further to analyze just how global poverty, rather than being reduced, is actually reproduced by the imperatives of capital accumulation on a global scale. Just as the global, environmental catastrophe cannot be resolved within capitalism, rooted as it is in contemporary mechanisms of exploitation and plunder, neither can human poverty be effectively eliminated by neoliberal “advances.”
eBook - ePub
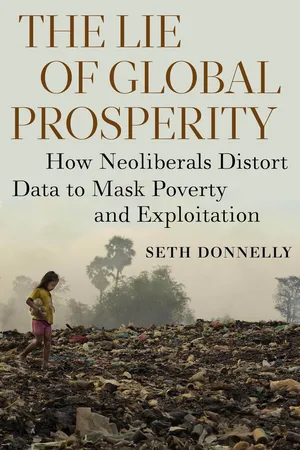
The Lie of Global Prosperity
How Neoliberals Distort Data to Mask Poverty and Exploitation
- English
- ePUB (mobile friendly)
- Available on iOS & Android
eBook - ePub
The Lie of Global Prosperity
How Neoliberals Distort Data to Mask Poverty and Exploitation
About this book
Trusted by 375,005 students
Access to over 1.5 million titles for a fair monthly price.
Study more efficiently using our study tools.
Information
PART ONE
GLOBAL POVERTY TODAY
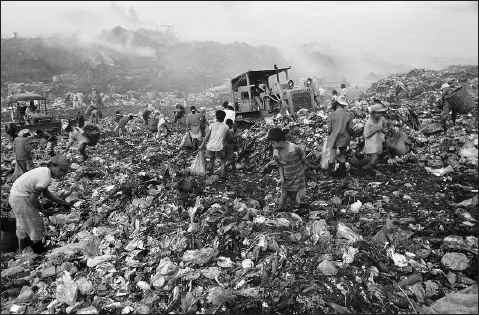
Smoky Mountain in Manila, Philippines. Photo: Nigel Dickinson.
Nigel Dickinson, PhotoShelter
Nigel Dickinson, PhotoShelter
1. Problems with the World Bank’s Poverty Metric
The headline of a 2015 World Bank press release reads: “World Bank Forecasts Global Poverty to Fall Below 10% for First Time.” This seemed like great news, something indeed worth celebrating. But what did it mean in terms of income? The statement means that soon 90 percent of the world’s population will live on $1.90 per day or more. This is the Bank’s International Poverty Line, which enjoys great legitimacy worldwide. One might wonder how the Bank established $1.90 daily as the threshold for extreme poverty. The institution’s publications reveal the basis for this figure to be surprisingly slim and arbitrary, based on doubtful reasoning and questionable data collection practices. A FAQ on the World Bank website explains the more or less circular procedure the Bank used to set the line:
In 1990, a group of independent researchers and the World Bank proposed to measure the world’s poor using the standards of the poorest countries in the World. They examined national poverty lines from some of the poorest countries in the world, and converted the lines to a common currency by using purchasing power parity (PPP) exchange rates. The PPP exchange rates are constructed to ensure that the same quantity of goods and services are priced equivalently across countries. Once converted into a common currency, they found that in six of these very poor countries the value of the national poverty line was about $1 per day per person, and this formed the basis for the first dollar-a-day international poverty line.15
Remarkably, the World Bank’s poverty line is based not on any direct and independent assessment of what people really need in terms of housing, food and clothing, but rather on previously existing poverty lines established by a minority of regimes in some of the poorest countries on the planet (only fifteen for the 2005 update to $1.25). Despite the Bank’s periodic updating of its poverty line (for example, from $1.25 to $1.90 in 2015), this fundamental problem remains. It seems reasonable to suppose that an international poverty line that is not based on concrete data but on thresholds set by governments that may allow political motivations to influence their poverty standards might fall short of representing what people really need. This is indeed the case. In 2013, the United Nations Conference on Trade and Development (UNCTAD) admitted:
The $1.25-a-day poverty line… falls far short of fulfilling the right to “a standard of living adequate for … health and well-being” (Universal Declaration of Human Rights, art.25.1) … Taking $5 as the minimum daily income which could reasonably be regarded as fulfilling this right, poverty would remain widespread even in those regions which might have largely or wholly eradicated extreme poverty [based on $1.25 per day] by 2030.16
Here we have an agency that is itself part of the UN recognizing the inadequacy of the standard threshold. Of course, figures such as $1.25 and $1.90 per day do indeed seem very low. But to get an understanding of just how low they are requires delving into the concept of purchasing power parity adjustments. Briefly, the upshot of purchasing power parity adjustment is that an income of $1.90 in the Bank’s statistics does not refer to what a U.S. tourist can purchase if she exchanges that sum for local currency in a Third World country. It refers instead to the purchasing power of $1.90 inside the United States. As Dr. Jason Hickel, an anthropologist at the London School of Economics, points out, that makes the Bank’s povertly threshold manifestly unreasonable:
How much is $1.90 per day, adjusted for purchasing power? Technically, it represents the international equivalent of what $1.90 could buy in the United States in 2011. But we know that this amount of money is inadequate to achieve even the most basic nutrition. The U.S. Department of Agriculture calculates that in 2011 the very minimum necessary to buy sufficient food was $5.04 per day. And that’s not taking account of other requirements for survival, such as shelter and clothing.
We have many examples of this deficit. In India, children living at $1.90 still have a 60% chance of being malnourished. In Niger, infants living at $1.90 have a mortality rate three times higher than the global average. The same story can be told of many other countries. If $1.90 is too low to achieve basic nutrition, or to secure a fair chance of surviving the first year of life, why are we using it?17
In place of the Bank’s $1.90 line, Hickel argues for a minimum that is much higher:
If we want to stick with a single international line, we might use the “ethical poverty line” devised by Peter Edward of Newcastle University. He calculates that in order to achieve normal human life expectancy of just over 70 years, people need roughly 2.7 to 3.9 times the existing poverty line. In the past, that was $5 a day [same as UNCTAD]. Using the bank’s new calculations, it’s about $7.40 a day. As it happens, this number is close to the average of national poverty lines in the global south.18
As Hickel points out, the $1.90 per day standard is extremely low in relation to most national poverty lines. It is about one-fourth of the Third World average, and it is approximately one-eighth of the U.S. poverty line.19 Since food can be just as expensive in Third World countries as in the United States, it is hard to see the reason for setting the line so low. Readers in the United States might consider that by the Bank’s standards anyone earning $57 per month in our context would no longer be “extremely poor.” Needless to say, living on that sum is almost unimaginable if we consider that it must cover all costs, including food, housing, and health care, and not just discretionary spending.
METHODOLOGICAL PROBLEMS OF THE BANK’S INTERNATIONAL POVERTY LINE
Household Surveys
The World Bank relies on “nationally representative household surveys” for its data on per capita income levels.20 The problem with such surveys, which register either household income or consumption, is their sometimes arbitrary relation to people’s real needs. On the one hand, some household surveys attach a monetary value to slum dwellings, which might boost a truly poor person above the official poverty line.21 On the other hand, they sometimes overlook important, even life-saving subsidies and public services that people might receive.
These kinds of errors can lead to profoundly paradoxical outcomes. An especially clear case is how the free health care, education, and food that people receive in Mao’s China do not enter into the calculation. As a result, Chinese people, who achieved new levels of food security and saw their life expectancy double in this period, were found to be on the whole “extremely poor.” The Bank considers them to have been worse off than Haitians who might scrape together just over $1.90 daily by selling goods in the informal market or working in sweatshops. From the Bank’s perspective, the Chinese only ceased to be “extremely poor” once they lost their collective lands, food rations, and medical care and began making iPhones and other export goods under atrocious conditions.22, 23
Purchasing Power Parity Conversion Factors
Setting an international poverty line requires comparing the purchasing power of different national currencies. Foreign exchange rates fail to solve this problem since they do not take into account local price structures. (A dollar won’t buy you a haircut in New York but, exchanged for 70 rupees, it might do so in Delhi.) The International Comparison Program (ICP), started by the UN Statistical Division in 1968, sets the purchasing power parity rates that attempt to equalize the purchasing power of different national currencies. In principle, PPPs can be used to compare national incomes in a way more meaningful than market exchange rates.
The World Bank uses PPPs to set the international poverty line, and to update it so that the line allegedly reflects the same level of well-being in each country. The original dollar-a-day line, set in 1995 using PPPs from 1985, was updated to $1.08 in 1993 with PPPs from that year, and then was kicked up to $1.25 with the publication of new PPPs in 2005.24 To date, the Bank’s latest revision is $1.90 per day and is based on the 2011 PPP rates. Contrary to appearances, this new, nominally larger figure does not mean that the Bank raised the poverty threshold; in fact, setting it at $1.90 per day actually lowered the threshold, conveniently erasing 100 million poor people overnight.25
The Bank and the OECD use the PPP rates not just to set the extreme poverty threshold but also to compare different countries GDPs, attempting to adjust for the distorting effects of normal market exchange rates. The theory is that PPP rates can provide a statistical correction for the overvaluation or undervaluation—via prevailing market exchange rates—of national currencies that can inflate or deflate GDPs. By using the PPP rates, the ICP can better gauge the real size of the world economy. In the language of the ICP:
The ICP compares the gross domestic products (GDPs) of participating economies in real terms by removing the differences that are attributable to price levels and expressing the GDPs in a common currency … ICP comparisons of price and real expenditure levels of GDP are based on the expenditure aggregates of the national accounts using spatial price deflators or purchasing power parities (PPPs) as the measure of the price component. In these cases, the prices of products constituting final demand are collected and compared across economies to produce the price relatives, the PPPs, with which the GDPs and component expenditures being compared are deflated to obtain the real expenditure relatives.26
How does the ICP establish its PPP rates? It does so by collecting data on an internationally standardized “basket of goods and services.” By comparing the prices of this standard basket in different national contexts, the ICP can establish the price ratios between comparable goods and services between countries. These indices are expressed through a common baseline international currency, which is the U.S. dollar.27 As the ICP explained in its 2017 brochure:
Suppose that there is a basket of goods and services that costs 50 United States dollars (USD). 50 USD would be equivalent to 363 South African Rand (ZAR) when using a market exchange rate of 7.26. However, due to South Africa’s lower price level in relation to the United States, the cost of a similar basket is actually 239 ZAR. Therefore, 50 USD would buy a larger basket of goods and services in South Africa than it would in the United States; the PPP of South Africa to the United States would be 239 ZAR/50 USD, which is equal to 4.77.
Interestingly, the PPP conversion factors between the United States and other OECD countries are often close to market exchange rates. Unlike the typical case when comparing rich and poor nations, the price structures of the former are similar.
The ICP next aggregates consumption patterns and priorities of people in both First World and Third World countries, thereby creating international “expenditure weights” within the basket, for example, food and services. Such aggregate weights, along with the PPP indices, are used to calculate the PPP conversion factors that determine the ratios of local currencies to the U.S. dollar. According to the Comprehensive Report by the World Bank Group of the 2011 International Comparison Program:
PPPs are calculated in stages: first for individual goods and services, then for groups of products, and finally for each of the various levels of aggregation up to GDP. PPPs continue to be price relatives whether they refer to a product group, to an aggregation level, or to GDP. As one moves up the aggregation hierarchy, the price relatives refer to increasingly complex assortments of goods and services. Therefore, if the PPP for GDP between France and the United States is €0.95 to the dollar, it can be inferred that for every dollar spent on GDP in the United States, €0.95 would have to be spent in France to purchase the same volume of goods and services. Purchasing the same volume of goods and services does not mean that the baskets of goods and services purchased in both economies will be identical. The composition of the baskets will vary between economies and reflect differences in taste, culture, climate, price structure, product availability, and income level, but both baskets will, in principle, provide equivalent satisfaction or utility.28
The PPP rates are based on the reference year in which the ICP published the latest PPP indices between goods and services within the basket. The most recent reference year is 2011. Despite the reasoning behind PPP conversion factors, it is doubtful that their use is any less arbitrary than employing normal market exchange rates in international poverty assessments or GDP comparisons. Using PPP conversion factors means that if the price of a significant commodity such as housing is particularly high or low in the base country (the United States) in the reference year, this will influence the PPP conversion factors with other countries.
The upshot of PPP conversions is that the “dollar a day” poverty line really gravitates around a half or a third of a dollar for many countries. This is because, even if the U.S. dollar serves to establish the Bank’s international poverty line, the dollars referred to are not based on what the dollar can purchase in a foreign country via normal market exchange rates. Instead, the basis is the amount of a country’s currency that when used locally would have the same purchasing power as a dollar in the United States. The 2016 market exchange rate between the U.S. dollar and the Haitian gourde was approximately 1:63. Using this exchange rate, the current $1.90 poverty line would be equivalent to living in Haiti on about 120 gourdes per day. This is insufficient for survival, since it falls far short of the costs of securing nutrition, housing, transportation, energy, education, health care, clothing, cooking utensils, among other necessary goods in Haiti. Yet because of the PPP conversion rates, the Haitia...
Table of contents
- Cover
- Title Page
- Copyright
- Contents
- Dedication
- Preface
- Introduction: A New Millennium?
- Part One: Global Poverty Today
- Part Two: Going Beyond Statistics to the Dynamics of Imperialism
- Notes
- Index
Frequently asked questions
Yes, you can cancel anytime from the Subscription tab in your account settings on the Perlego website. Your subscription will stay active until the end of your current billing period. Learn how to cancel your subscription
No, books cannot be downloaded as external files, such as PDFs, for use outside of Perlego. However, you can download books within the Perlego app for offline reading on mobile or tablet. Learn how to download books offline
Perlego offers two plans: Essential and Complete
- Essential is ideal for learners and professionals who enjoy exploring a wide range of subjects. Access the Essential Library with 800,000+ trusted titles and best-sellers across business, personal growth, and the humanities. Includes unlimited reading time and Standard Read Aloud voice.
- Complete: Perfect for advanced learners and researchers needing full, unrestricted access. Unlock 1.5M+ books across hundreds of subjects, including academic and specialized titles. The Complete Plan also includes advanced features like Premium Read Aloud and Research Assistant.
We are an online textbook subscription service, where you can get access to an entire online library for less than the price of a single book per month. With over 1.5 million books across 990+ topics, we’ve got you covered! Learn about our mission
Look out for the read-aloud symbol on your next book to see if you can listen to it. The read-aloud tool reads text aloud for you, highlighting the text as it is being read. You can pause it, speed it up and slow it down. Learn more about Read Aloud
Yes! You can use the Perlego app on both iOS and Android devices to read anytime, anywhere — even offline. Perfect for commutes or when you’re on the go.
Please note we cannot support devices running on iOS 13 and Android 7 or earlier. Learn more about using the app
Please note we cannot support devices running on iOS 13 and Android 7 or earlier. Learn more about using the app
Yes, you can access The Lie of Global Prosperity by Seth Donnelly in PDF and/or ePUB format, as well as other popular books in Politics & International Relations & Social Policy. We have over 1.5 million books available in our catalogue for you to explore.