The increasing importance in laboratory situations of minutely precise measurements presents the chemist and physicist with numerous problems in data analysis. National Bureau of Standards statistics consultant John Mandel here draws a clear and fascinating blueprint for a systematic science of statistical analysis — geared to the particular needs of the physical scientist, with approach and examples aimed specifically at the statistical problems he is likely to confront.
The first third of The Statistical Analysis of Experimental Data comprises a thorough grounding in the fundamental mathematical definitions, concepts, and facts underlying modern statistical theory — math knowledge beyond basic algebra, calculus, and analytic geometry is not required. Remaining chapters deal with statistics as an interpretative tool that can enable the laboratory researcher to determine his most effective methodology. You'll find lucid, concise coverage of over 130 topics, including elements of measurement; nature of statistical analysis; design/analysis of experiments; statistics as diagnostic tool; precision and accuracy; testing statistical models; between-within classifications; two-way classifications; sampling (principles, objectives, methods); fitting of non-linear models; measurement of processes; components of variance; nested designs; the sensitivity ratio, and much more.
Also included are many examples, each worked in step-by-step fashion; nearly 200 helpful figures and tables; and concluding chapter summaries followed by references for further study.
Mandel argues that, when backed by an understanding of its theoretic framework, statistics offers researchers "not only a powerful tool for the interpretation of experiments but also a task of real intellectual gratification." The Statistical Analysis of Experimental Data provides the physical scientist with the explanations and models he requires to impress this invaluable tool into service.
- 432 pages
- English
- ePUB (mobile friendly)
- Available on iOS & Android
eBook - ePub
The Statistical Analysis of Experimental Data
About this book
Trusted by 375,005 students
Access to over 1.5 million titles for a fair monthly price.
Study more efficiently using our study tools.
Information
Subtopic
Probability & StatisticsIndex
Mathematicschapter 1
THE NATURE OF MEASUREMENT
1.1 TYPES OF MEASUREMENT
The term measurement, as commonly used in our language, covers many fields of activities. We speak of measuring the diameter of the sun, the mass of an electron, the intelligence of a child, and the popularity of a television show. In a very general sense all of these concepts may be fitted under the broad definition, given by Campbell (1), of measurement as the “assignment of numerals to represent properties.” But a definition of such degree of generality is seldom useful for practical purposes.
In this book the term measurement will be used in a more restricted sense: we will be concerned with measurement in the physical sciences only, including in this category, however, the technological applications of physics and chemistry and the various fields of engineering. Furthermore, it will be useful to distinguish between three types of measurements.
1. Basic to the physical sciences is the determination of fundamental constants, such as the velocity of light or the charge of the electron. Much thought and experimental work have gone into this very important but rather specialized field of measurement. We will see that statistical methods of data analysis play an important role in this area.
2. The purpose behind most physical and chemical measurements is to characterize a particular material or physical system with respect to a given property. The material might be an ore, of which it is required to determine the sulfur content. The physical system could be a microscope, of which we wish to determine the magnification factor. Materials subjected to chemical analysis are generally homogeneous gases, liquids or solids, or finely ground and well-mixed powders of known origin or identity. Physical systems subjected to measurement consist mostly of specified component parts assembled in accordance with explicit specifications. A careful and precise description of the material or system subjected to measurement as well as the property that is to be measured is a necessary requirement in all physical science measurements. In this respect, the measurements in the second category do not differ from those of category 1. The real distinction between the two types is this: a method of type 1 is in most cases a specific procedure, applicable only to the determination of a single fundamental constant and aiming at a unique number for this constant, whereas a method of type 2 is a technique applicable to a large number of objects and susceptible of giving any value within a certain range. Thus, a method for the measurement of the velocity of light in vacuo need not be applicable to measuring other velocities, whereas a method for determining the sulfur content of an ore should retain its validity for ores with varying sulfur contents.
3. Finally, there are methods of control that could be classified as measurements, even though the underlying purpose for this type of measurement is quite different from that of the two previous types. Thus, it may be necessary to make periodic determinations of the pH of a reacting mixture in the production of a chemical or pharmaceutical product. The purpose here is not to establish a value of intrinsic interest but rather to insure that the fluctuations in the pH remain within specified limits. In many instances of this type, one need not even know the value of the measurement since an automatic mechanism may serve to control the desired property.
We will not be concerned, in this book, with measurements of type 3. Our greatest emphasis by far will be on measurements belonging to the second type. Such measurements involve three basic elements: a material or a physical system, a physical or chemical property, and a procedure for determining the value of such a property for the system considered. Underlying this type of measurement is the assumption that the measuring procedure must be applicable for a range of values of the property under consideration.
1.2 MEASUREMENT AS A PROCESS
The process of assigning numerals to properties, according to Campbell’s definition, is of course not an arbitrary one. What is actually involved is a set of rules to be followed by the experimenter. In this respect, the measurement procedure is rather similar to a manufacturing process. But whereas a manufacturing process leads to a physical object, the measuring process has as its end result a mere number (or an ordered set of numbers). The analogy can be carried further. Just as in a manufacturing process, environmental conditions (such as the temperature of a furnace, or the duration of a treatment) will in general affect the quality of the product, so, in the measuring process, environmental conditions will also cause noticeable variations in the numbers resulting from the operation. These variations have been referred to as experimental error. To the statistician, experimental error is distinctly different from mistakes or blunders. The latter result from departures from the prescribed procedure. Experimental error, on the other hand, occurs even when the rules of the measuring process are strictly observed, and it is due to whatever looseness is inherent in these rules. For example, in the precipitation step of a gravimetric analysis, slight differences in the rate of addition of the reagent or in the speed of agitation are unavoidable, and may well affect the final result. Similarly, slight differences in the calibration of spectrophotometers, even of the same type and brand, may cause differences in the measured value.
1.3 MEASUREMENT AS A RELATION
Limiting our present discussion to measurements of the second of the three types mentioned in Section 1.1, we note an additional aspect of measurement that is of fundamental importance. Measurements of this type involve a relationship, similar to the relationship expressed by a mathematical function. Consider for example a chemical analysis made by a spectrophotometric method. The property to be measured is the concentration, c, of a substance in solution. The measurement, T, is the ratio of the transmitted intensity, I, to the incident intensity, I0. If Beer’s law (3) applies, the following relation holds:
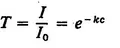
(1.1)
Thus, the measured quantity, T, is expressible as a mathematical function of the property to be measured, c. Obviously, the two quantities, T and c, are entirely distinct. It is only because of a relationship such as Eq. 1.1 that we can also claim to have measured the concentration c by this process.
Many examples can be cited to show the existence of a relationship in measuring processes. Thus, the amount of bound styrene in synthetic rubber can be measured by the refractive index of the rubber. The measurement of forces of the order of magnitude required for rocket propulsion is accomplished by determining changes in the electrical properties of proving rings subjected to these forces. In all these cases, three elements are present: a property to be determined (P), a measured quantity (M), and a relationship between these two quantities:

(1.2)
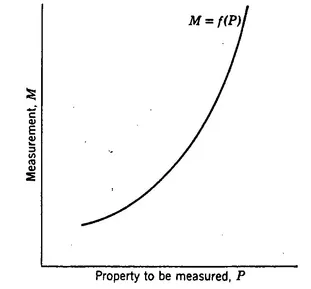
Fig. 1.1 A monotonic relationship associated with a measuring process.
Figure 1.1 is a graphical representation of the relationship associated with a measuring process.
1.4 THE ELEMENTS OF A MEASURING PROCESS
The description of a measuring process raises a number of questions. In the first place, the quantity P requires a definition. In many cases P cannot be defined in any way other than as the result of the measuring process itself; for this particular process, the relationship between measurement and property then becomes the identity M ≡ P; and the study of any new process, M′, for the determination of P is then essentially the study of the relationship of two measuring processes, M and M′.
In some technological problems, P may occasionally remain in the form of a more or less vague concept, such as the degree of vulcanization of rubber, or the surface smoothness of paper. In such cases, the relation Eq. 1.2 can, of course, never be known. Nevertheless, this relation remains useful as a conceptual model even in these cases, as we will see in greater detail in a subsequent chapter.
Cases exist in which the property of interest, P, is but one of the parameters of a statistical distribution function, a concept which will be defined in Chapter 3. An example of such a property is furnished by the number average molecular weight of a polymer. The weights of the molecules of the polymer are not all identical and follow in fact a statistical distribution function. The number average molecular weight is the average of the weights of all molecules. But the existence of this distribution function makes it possible to define other parameters of the distribution that are susceptible of measurement, for example, the weight average molecular weight. Many technological measuring processes fall in this category. Thus, the elongation of a sheet of rubber is generally determined by measuring the elongation of a number of dumbbell specimens cut from the sheet. But these individual measurements vary from specimen to specimen because of the heterogeneity of the material, and the elongation of the entire sheet is best defined as a central parameter of the statistical distribution of these individual elongations. This central parameter is not necessarily the arithmetic average. The mediana is an equally valid parameter and may in some cases be more meaningful than the average.
A second point raised by the relationship aspect of measuring processes concerns the nature of Eq. 1.2. Referring to Fig. 1.1, we see that the function, in order to be of practical usefulness, must be monotonic, i.e., M must either consistently increase or consistently decrease, when P increases. Figure 1.2 represents a non-monotonic function; two different values, P1 and P2 of the property give rise to the same value, M, of the measurement. Such a situation is intolerable unless the process is limited to a range of P values, such as PP’, within which the curve is indeed monotonic.
The relation between M and P is specific for any particular measuring process. It is generally different for two different processes, even when the property P is the same in both instances. As an example we may consider two different analytical methods for the determination of per cent chromium in steel, the one gravimetric and the other spectrophotometric. The property P, per cent chromium, is the same in both cases; yet the curve relating measurement and property is different in each case. It is important to realize that this curve varies also with the type of material or the nature of the physical system. The determination of sulfur in an ore is an entirely diffe...
Table of contents
- Dover Books on Mathematics
- Title Page
- Copyright Page
- Preface
- Table of Contents
- INTRODUCTION
- chapter 1 - THE NATURE OF MEASUREMENT
- chapter 2 - STATISTICAL MODELS AND STATISTICAL ANALYSIS
- chapter 3 - THE MATHEMATICAL FRAMEWORK OF STATISTICS, PART I
- chapter 4 - THE MATHEMATICAL FRAMEWORK OF STATISTICS, PART II
- chapter 5 - HOMOGENEOUS SETS OF MEASUREMENTS
- chapter 6 - THE PRECISION AND ACCURACY OF MEASUREMENTS
- chapter 7 - THE METHOD OF LEAST SQUARES
- chapter 8 - TESTING THE STATISTICAL MODEL
- chapter 9 - THE ANALYSIS OF STRUCTURED DATA
- chapter 10 - SOME PRINCIPLES OF SAMPLING
- chapter 11 - THE FITTING OF CURVES AND SURFACES
- chapter 12 - THE FITTING OF STRAIGHT LINES
- chapter 13 - THE SYSTEMATIC EVALUATION OF MEASURING PROCESSES
- chapter 14 - THE COMPARISON OF METHODS OF MEASUREMENT
- APPENDIX
- Index
Frequently asked questions
Yes, you can cancel anytime from the Subscription tab in your account settings on the Perlego website. Your subscription will stay active until the end of your current billing period. Learn how to cancel your subscription
No, books cannot be downloaded as external files, such as PDFs, for use outside of Perlego. However, you can download books within the Perlego app for offline reading on mobile or tablet. Learn how to download books offline
Perlego offers two plans: Essential and Complete
- Essential is ideal for learners and professionals who enjoy exploring a wide range of subjects. Access the Essential Library with 800,000+ trusted titles and best-sellers across business, personal growth, and the humanities. Includes unlimited reading time and Standard Read Aloud voice.
- Complete: Perfect for advanced learners and researchers needing full, unrestricted access. Unlock 1.5M+ books across hundreds of subjects, including academic and specialized titles. The Complete Plan also includes advanced features like Premium Read Aloud and Research Assistant.
We are an online textbook subscription service, where you can get access to an entire online library for less than the price of a single book per month. With over 1.5 million books across 990+ topics, we’ve got you covered! Learn about our mission
Look out for the read-aloud symbol on your next book to see if you can listen to it. The read-aloud tool reads text aloud for you, highlighting the text as it is being read. You can pause it, speed it up and slow it down. Learn more about Read Aloud
Yes! You can use the Perlego app on both iOS and Android devices to read anytime, anywhere — even offline. Perfect for commutes or when you’re on the go.
Please note we cannot support devices running on iOS 13 and Android 7 or earlier. Learn more about using the app
Please note we cannot support devices running on iOS 13 and Android 7 or earlier. Learn more about using the app
Yes, you can access The Statistical Analysis of Experimental Data by John Mandel in PDF and/or ePUB format, as well as other popular books in Mathematics & Probability & Statistics. We have over 1.5 million books available in our catalogue for you to explore.