This book was written with a dual purpose: first, the author was motivated to relieve his distress over the faulty conclusions drawn from the frequent misuse of relatively simple statistical tools such as percents, graphs, and averages. Second, his objective was to create a nontechnical book that would help people make better-informed decisions by increasing their ability to judge the quality of statistical evidence. This volume achieves both, serving as a supplemental text for students taking their first course in statistics, and as a self-help guide for anyone wishing to evaluate statistical evidence more judiciously.
The sequence of topics corresponds with that of many beginning textbooks in statistics, and the terminology and treatment of subjects are based on the assumption that readers have had little or no prior exposure to statistics or formal mathematics. The author examines the perils of statistical ignorance, some problems in basic measurement and definition, and the prevalence of meaningless statistics, far-fetched estimates, cheating charts, and accommodating averages. He explains common pitfalls of statistical thinking such as ignoring dispersion, inflating percentages, drawing improper comparisons, jumping to conclusions, and making errors of probability and induction. Playful in tone but scrupulously accurate in nature, this text is equally valuable in and out of the classroom.
- 208 pages
- English
- ePUB (mobile friendly)
- Available on iOS & Android
eBook - ePub
Flaws and Fallacies in Statistical Thinking
About this book
Trusted by 375,005 students
Access to over 1.5 million titles for a fair monthly price.
Study more efficiently using our study tools.
Information
1
Dangers of Statistical Ignorance
Statistical thinking will one day be as necessary for efficient citizenship as the ability to read and write.
—H. G. WELLS
This book is unusual. Textbooks show you facts and the right methods. This book shows you fallacies and the wrong methods. It will serve as a companion volume to any textbook on statistics. It will also serve as a self- help guide to distinguish between valid and faulty statistical reasoning.
Furthermore, it deals with a very important subject because statistics influence our daily lives in a great many ways. By enlisting the aid of statistics, we measure economic activity; record social progress; elect Presidents and keep abreast of their current popularity (or, more often, unpopularity); measure intelligence, interests, and aptitudes; compare his sexual habits with various norms; determine which television shows will survive and which will not; compare the profit potential of several alternative business strategies; decide whether to invest in bonds or stocks and, if the latter, whether now is a good time to get into the market; keep track of batting averages; assess the likelihood of rain tomorrow; and, in general, keep informed about what is going on in the world with the aid of statistical data gathered, presented, and interpreted by others. Even if you and I have nothing to do with the actual calculations implied by the items in this list (or the many other items that might easily have been included), as socially conscious citizens we should be able to interpret the results of such calculations with some sophistication, for these are the figures that serve as a basis for so many vital newspaper and magazine articles, books, and speeches.
Although something of an exaggeration, the quote from H. G. Wells that introduced this chapter is basically sound. I would amend it only in one important respect and have it read “Statistical [straight] thinking will one day be as necessary for efficient citizenship as the ability to read and write.” I prefer “statistical straight thinking” to “statistical thinking” because it seems unlikely that fuzzy or erroneous thinking could contribute much to efficient citizenship—or efficient anything else, for that matter. Unfortunately, there is enough fuzzy and erroneous statistical thinking around these days to justify my focusing on it in this book.
This book deals with erroneous and sometimes deliberately misleading statistical arguments. It deals with fallacious statistical thinking—how to avoid doing it yourself and how to recognize when others do it. This point requires elaboration. First, however, let us touch on some essential back-ground topics, not the least important of which is what is meant by statistics.
The Two Meanings of “Statistics”
What is or are statistics? The word has two widely used meanings. The most generally familiar—and for many people the least interesting—can probably be introduced most painlessly by the following excerpt from O. Henry’s Handbook of Hymen:
“Let us sit on this log at the roadside,” says I, “and forget the inhumanity and ribaldry of the poets. It is in the columns of ascertained facts and legalized measures that beauty is to be found. In this very log we sit upon, Mrs. Sampson,” says I, “is statistics more wonderful than any poem. The rings show it is sixty years old. At the depth of two thousand feet it would become coal in three thousand years. The deepest coal mine in the world is at Killingworth near New Castle. A box four feet long, three feet wide, and two feet eight inches deep will hold one ton of coal. If an artery is cut compress it above the wound. A man’s leg contains thirty bones. The Tower of London was burned in 1841.”
“Go on, Mr. Pratt,” says Mrs. Sampson, “Them ideas is so original and soothing. I think statistics are just as lovely as they can be.”
Although not all of Mr. Pratt’s original and soothing ideas are really statistics, enough of them are to convey the idea that a statistic is a fact. More precisely, it is a fact expressed as a number and can be a measurement, a count, or a rank. A statistic in this first sense can even be a summary measure such as a total, an average, or a percentage of several such measurements, counts, or ranks.
In addition to referring to numerical facts, the term “statistics” also applies to the broad discipline of statistical manipulation in much the same way that “accounting” applies to the entering and balancing of accounts. “Statistics” in this broader sense is a set of methods for obtaining, organizing, summarizing, presenting, and analyzing numerical facts. Usually these numerical facts represent partial rather than complete knowledge about a situation, as is the case when a sample is used in lieu of a complete census. Generally speaking, numerical facts are subjected to formal statistical analysis in order to help someone make wise decisions in the face of uncertainty or to help researchers arrive at scientifically-sound generalizations or principles.
The word “statistics” will be used in both senses throughout this book. The context within which the term is used should make the intended meaning clear.
The Statistical Fallacy
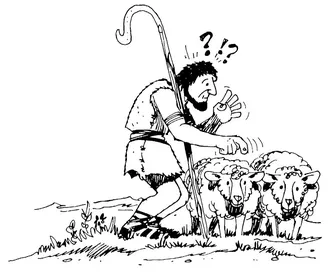
No one knows just when the first statistical lie was foisted upon a trusting listener. For that matter, no one knows for certain when or where statistics first appeared. We do know that the earliest written records contain numbers, a fact suggesting that the ability to count goes way back. The Bible tells us that statistics in the purely descriptive sense were used to provide information about taxes, wars, agriculture, and even athletic events. Nevertheless, there probably was a time when counting, and therefore statistics, was unknown; a time when a shepherd, for example, did not describe his flock as consisting of twenty, fifty, or one hundred sheep but instead kept track of his woolly charges by assigning each a name. If two sheep turned up missing, the shepherd searched not for two anonymous animals but for, say, Peter and Paul.
Although the first uses of statistics are lost in antiquity, I would wager that misuses of statistics—intentional and unintentional—first appeared at about the same time as valid statistics. We all know people whose honesty we have good reason to doubt as well as people who are chronically careless or conspicuously stupid. Certainly there must have been counterparts of such people from the very beginning just as there must have been counterparts of you and me—honest, meticulous, and highly intelligent. Not much imagination is required to envision our shepherd, recounting the harrowing challenges he faced while retrieving his two wayward sheep, Peter and Paul, and, rather than spoiling a good story by undertelling it, claiming that Mary and Ruth had also gone astray (had gotten lost, that is). The advent of counting and statistics certainly didn’t create the all-too-human tendencies to lie, exaggerate, or make honest mistakes, but it did introduce a whole new, very colorful means of giving vent to such tendencies.
Today, statistical fallacies abound in our newspapers, magazines, advertisements, and conversations. I am not suggesting that all statistical evidence is faulty. Indeed, the proliferation of statistical fallacies in recent decades has been, to a considerable extent, the natural result of burgeoning statistical data and formal techniques for analyzing such data. But even so, the mere existence of statistical fallacies imposes a responsibility upon the citizen who would call himself well informed to learn to distinguish between erroneous and valid statistics or statistical arguments.
How dangerous are statistical fallacies? No general answer is possible. Some statistical fallacies are undoubtedly perfectly harmless even when widely believed. But some are much more potentially dangerous than you might suppose. Let us consider a few examples.
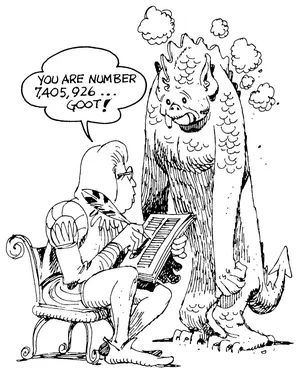
If an award is ever granted the fabricator of the world’s phoniest but possibly least harmful statistic of a descriptive nature, I suggest that the honor be bestowed posthumously upon a German named Weirus. Weirus, who served as physician to the Duke of Cleaves during the latter part of the sixteenth century, a time when most of Europe was gripped by the fear of demons and witches, had some definite opinions about the number of demons in existence. Whereas most of his contemporaries lazily assumed that demons were too plentiful for their numbers to be determined, Weirus, using methods beyond anyone else’s comprehension, calculated that exactly 7,405,926 demons inhabited the earth; these, he claimed, were divided into seventy-two battalions, each under a prince or captain.1
How serious Weirus was when he revealed his remarkable findings is anybody’s guess. According to Sir Walter Scott, “Weirus was one of the first who attacked the vulgar belief and boldly assailed, both by serious argument and by ridicule, the vulgar credulity on the subject of wizards and witches.“2 Quite possibly the good doctor had his tongue planted firmly in his cheek when he revealed his spurious figures. If so, many historians have not been in on the joke for they have written of the incident as if they believed Weirus to be dead serious. Moreover, you can bet that many people hearing of the doctor’s calculations accepted the bogus results without question, thinking that 7,405,926 sounded “about right.” And why not? To them demons were a reality and Weirus was a learned man. In the final analysis, however, it is hard to imagine how Weirus’ figures could have done anyone harm, except perhaps Weirus himself if he really was poking fun at the prevailing beliefs of his day.
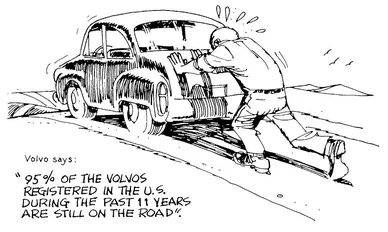
Here is a more modern-day example. A 1968 advertisement for Volvo automobiles is a treasure trove of statistical fallacies, but that unfortunate fact didn’t keep it from appearing in many of the country’s top magazines. The advertisement states that, according to statistics, the average American drives 50 years in his lifetime and the average car is traded in on a new one every three years and three months. The logical conclusion, we are informed, is that if one drives an average number of years in average cars, he will own 15.1 cars in his lifetime. But not so if he owns a Volvo. The lucky Volvo owner, the ad asserts, can get by with only 4.5 Volvos because in Sweden Volvos last an average of 11 years.
The advertisement goes on to say, “We don’t guarantee they’ll last that long here where being a car is relatively easy. But we do know that over 95 % of all Volvos registered here in the last 11 years are still on the road.”
The Volvo may indeed be a durable, well-constructed automobile—I have no convictions one way or the other—but, despite the collection of presumably authentic figures, this advertisement conveys no genuine information about the Volvo’s durability relative to that of other cars.
Aside from the question of whether the number of years a car is driven is the most meaningful possible measure of durability (why not number of miles driven instead?), two clear-cut fallacies stand out. First, an improper comparison is made. The almost adjacent statements “The average car is traded in on a new one every three years and three months” and “Volvos last 11 years . . . .” is an apples and oranges comparison if there ever was one. Obviously, the number of years an automobile can be driven before it becomes incapable of providing transportation and the number of years an automobile is driven before the owner tires of it and voluntarily trades the still usable vehicle in on a newer model are two very different matters. No meaningful comparison whatever can be made between the two figures.
Second, the last part of this ad—the part that states “ . . . . over 95 % of all Volvos registered here in the last 11 years are still on the road”—is no more informative than the first part and is just as potentially misleading. Suppose, for example, that all Volvo sales made during the 11 year period referred to (apparently 1957 through 1967 inclusive) had been made during the most recent year and none whatever during the preceding ten years. In such a case, the figure of 95 percent would be indicative of poor rather than outstanding durability because it would mean that five percent of the Volvos sold had to be scrapped during their first year of use. Actual sales admittedly were not bunched so dramatically, but, according to a 1968 issue of Ward’s Automotive Reports, approximately 45 to 50 percent of the Volvo sales in this country were made during the most recent four years of the 11-year period in question. The 95 percent figure, therefore, says little or nothing about the Volvo’s durability.
What can we conclude about this advertisement other than it is much more misleading than informative? Is it dangerous? That is quite possibly a different matter altogether. If the Volvo is in fact an unusually durable car, then the advertisement presumably did no real harm. (Of course, one can hardly help wondering why, if the car really is all that durable, the company has to resort to half-truths to sell it.) But if the Volvo really is no more durable than other makes, and certainly if it is less durable, then many automobile buyers might have been led astray by the ad, and, according to any criteria I can think of, the statistical fallacies that helped to sell the car would have to be viewed as dangerous.
Now let us consider two heavyweights. These are examples of statistical fallacies whose propensities for causing trouble are incalculably great. The first example comes from a Playboy Magazine interview with the late George Lincoln Rockwell, commander of the American Nazi Party:3
Rockwell: A psychologist named G.O. Ferguson made a definitive study of the connection between the amount of white blood and intelligence in niggers. He tested all the nigger school children in Virginia and proved that the pure-black niggers did only about 70 percent as well as the white children. Niggers with one white grandparent did about 75 percent as well as the white children. Niggers with two white grandparents did still better and niggers with three white grandparents did almost as well as the white kids. Since all these nigger children shared exactly the same environment as niggers, it’s impossible to claim that environment produced these tremendous changes in performance.
Playboy: In his book, A Profile of the Negro American, the world-famed sociologist, T. F. Pettigrew states flatly that the degree of white ancestry does not relate in any way to Negro I. Q. scores. According to Pettigrew, the brightest Negro yet reported—with a tested I. Q. of 200—had no traceable Caucasian heritage whatever.
Rockwell: The fact that you can show me one very black individual who is superior to me doesn’t convince me that the average nigger is superior. The startling fact I see is that the lighter they are, the smarter they are, and the blacker they are, the dumber they are.
Rockwell’s faith in the Ferguson study might be rather touching if the moral stakes weren’t so high and if the study enjoyed any scientific repute, a consideration that Rockwell didn’t bother to worry about. But as the magazine’s editors point out:
Ferguson’s study, conducted in 1916, we later learned, has since been discredited by every major authority on genetics and anthropology; they call it a pseudoscientific rationale for racism, ...
Table of contents
- Title Page
- Copyright Page
- Dedication
- Table of Contents
- Preface
- 1 - Dangers of Statistical Ignorance
- 2 - Some Basic Measurement and Definition Problems
- 3 - Meaningless Statistics
- 4 - Far-Fetched Estimates
- 5 - Cheating Charts
- 6 - Accommodating Averages
- 7 - Ignoring Dispersion
- 8 - Puffing Up a Point with Percents
- 9 - Improper Comparisons
- 10 - Jumping to Conclusions
- 11 - Faulty Thinking About Probability
- 12 - Faulty Induction
- 13 - Relationships: Causal and Casual
- 14 - Leftovers
- 15 - Assorted Examples to Think About
- Index
Frequently asked questions
Yes, you can cancel anytime from the Subscription tab in your account settings on the Perlego website. Your subscription will stay active until the end of your current billing period. Learn how to cancel your subscription
No, books cannot be downloaded as external files, such as PDFs, for use outside of Perlego. However, you can download books within the Perlego app for offline reading on mobile or tablet. Learn how to download books offline
Perlego offers two plans: Essential and Complete
- Essential is ideal for learners and professionals who enjoy exploring a wide range of subjects. Access the Essential Library with 800,000+ trusted titles and best-sellers across business, personal growth, and the humanities. Includes unlimited reading time and Standard Read Aloud voice.
- Complete: Perfect for advanced learners and researchers needing full, unrestricted access. Unlock 1.5M+ books across hundreds of subjects, including academic and specialized titles. The Complete Plan also includes advanced features like Premium Read Aloud and Research Assistant.
We are an online textbook subscription service, where you can get access to an entire online library for less than the price of a single book per month. With over 1.5 million books across 990+ topics, we’ve got you covered! Learn about our mission
Look out for the read-aloud symbol on your next book to see if you can listen to it. The read-aloud tool reads text aloud for you, highlighting the text as it is being read. You can pause it, speed it up and slow it down. Learn more about Read Aloud
Yes! You can use the Perlego app on both iOS and Android devices to read anytime, anywhere — even offline. Perfect for commutes or when you’re on the go.
Please note we cannot support devices running on iOS 13 and Android 7 or earlier. Learn more about using the app
Please note we cannot support devices running on iOS 13 and Android 7 or earlier. Learn more about using the app
Yes, you can access Flaws and Fallacies in Statistical Thinking by Stephen K. Campbell in PDF and/or ePUB format, as well as other popular books in Mathematics & Probability & Statistics. We have over 1.5 million books available in our catalogue for you to explore.