![]()
Chapter 1
Graphs
Section 1.0 Introduction
For years, mathematicians have affected the growth and development of computer science. In the beginning they helped design computers for the express purpose of simplifying large mathematical computations. However, as the role of computers in our society changed, the needs of computer scientists began affecting the kind of mathematics being done.
Graph theory is a prime example of this change in thinking. Mathematicians study graphs because of their natural mathematical beauty, with relations to topology, algebra and matrix theory spurring their interest. Computer scientists also study graphs because of their many applications to computing, such as in data representation and network design. These applications have generated considerable interest in algorithms dealing with graphs and graph properties by both mathematicians and computer scientists.
Today, a study of graphs is not complete without at least an introduction to both theory and algorithms. This text will attempt to convince you that this is simply the nature of the subject and, in fact, the way it was meant to be treated.
Section 1.1 Fundamental Concepts and Notation
Graphs arise in many settings and are used to model a wide variety of situations. Perhaps the easiest way to adjust to this variety is to see several very different uses immediately. Initially, let’s consider several problems and concentrate on finding models representing these problems, rather than worrying about their solutions.
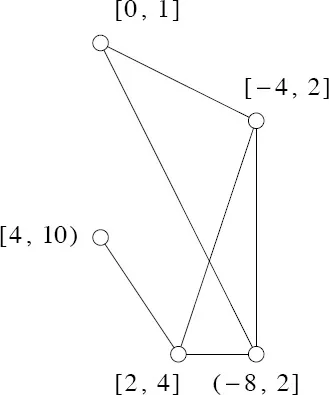
Suppose that we are given a collection of intervals on the real line, say C = { I1, I2, . . . , Ik}. Any two of these intervals may or may not have a nonempty intersection. Suppose that we want a way to display the intersection relationship among these intervals. What form of model will easily display these intersections?
One possible model for representing these intersections is the following: Let each interval be represented by a circle and draw a line between two circles if, and only if, the intervals that correspond to these circles intersect. For example, consider the set
C = { [−4, 2], [0, 1], (−8, 2], [2, 4], [4, 10) }.
The model for these intervals is shown in Figure 1.1.1.
Figure 1.1.1. A model for the intersections of the members of C.
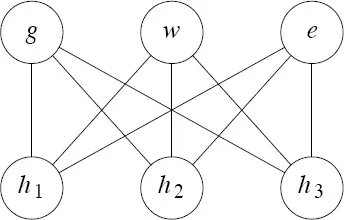
Next, we consider the following old puzzle. Suppose there are three houses (call them h1, h2 and h3) and three utility companies (say gas (g), water (w) and electricity (e)). Our problem is to determine if it is possible to connect each of the three houses to each of the three utilities without crossing the service lines that run from the utilities to the houses. We model this puzzle by representing each house and each utility as a circle and drawing a line between two circles if there is a service line between the corresponding house and utility. We picture this situation in Figure 1.1.2. A solution to this problem would be a drawing in which no lines crossed. The drawing of Figure 1.1.2 is not a solution to the problem, but merely an attempt at modeling the problem.
Figure 1.1.2. The three houses and three utilities model.
In our third problem, suppose you are the manager of a company that has four job openings (say j1, j2, j3 and j4) and five applicants a1, . . . , a5 and that some of these applicants are qualified for more than one of your jobs. How do you go about choosing people to fill the jobs so that you will fill as many openings as possible? We picture such a situation in Figure 1.1.3. Again, each job and each applicant can be represented as a circle. This time, a line is drawn from a circle represe...