The second in a series of systematic studies by a celebrated mathematician I. M. Gelfand and colleagues, this volume presents students with a well-illustrated sequence of problems and exercises designed to illuminate the properties of functions and graphs. Since readers do not have the benefit of a blackboard on which a teacher constructs a graph, the authors abandoned the customary use of diagrams in which only the final form of the graph appears; instead, the book's margins feature step-by-step diagrams for the complete construction of each graph. The first part of the book employs simple functions to analyze the fundamental methods of constructing graphs. The second half deals with more complicated and refined questions concerning linear functions, quadratic trinomials, linear fractional functions, power functions, and rational functions.
Trusted by 375,005 students
Access to over 1.5 million titles for a fair monthly price.
If the definition is followed literally, then in order to construct a graph of some function, it is necessary to find all pairs of corresponding values of argument and function and to construct all points with these co-ordinates. In the majority of cases it is practically impossible to do this, since there are infinitely many such points. Therefore, usually a few points belonging to the graph are joined by a smooth curve.
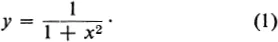
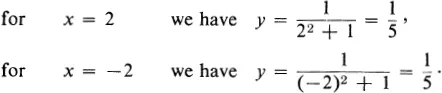
In this way, let us try to construct the graph of the function
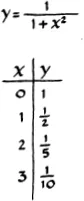
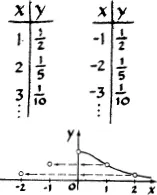
Table 1
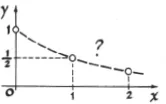
Let us choose some values of the argument, find the corresponding values of the function, and write them down in a table (see Table 1). We construct the points with the computed coordinates and join them by a dotted line, for the time being (Fig. 1).
Fig. 1
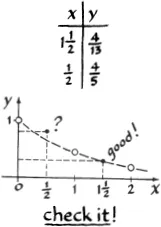
Let us now verify whether we have drawn the curve correctly between the points found to lie on the graph. For this purpose let us take some intermediate value of the argument, say,
, and compute the corresponding value of the function
. The point obtained,
, falls nicely on our curve (Fig. 2), so that we have drawn it quite accurately.
Fig. 2
Now we try
. Then
, and the corresponding point lies above the curve we have drawn (Fig. 2). This means that between x = 0 and x = 1 the graph does not go as we thought. Let us take two more values,
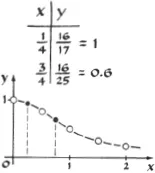
and
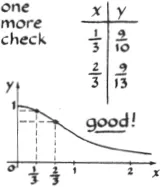
, in this doubtful section. After connecting all these points, we get the more accurate curve represented in Fig. 3. The points
and
, taken as a check, fit the curve nicely.
Fig. 3
2
In order to construct the left half of the graph, it is necessary to fill in one more table for negative values of the argument. This is easy to do. For example,
This means that together with the point
, the graph also contains
, the point symmetric to the first with respect to the y-axis.
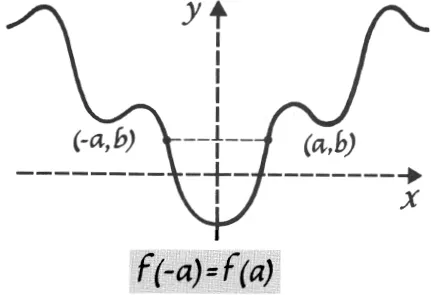
In general, if the point (a, b) lies on the right half of our graph, then its left half will contain the point (−a, b) symmetric to (a, b) with respect to the y-axis (Fig. 4). Therefore, in order to obtain the left part of the graph of function (1) corresponding to negative values of x, it is necessary to reflect the right half of this graph in the y-axis.
Fig. 4
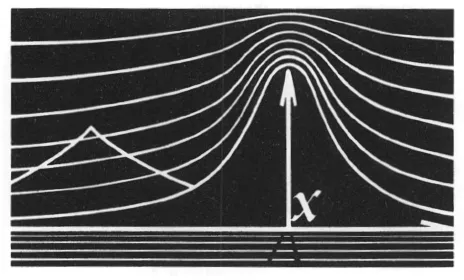
Figure 5 shows the over-all form of the graph.
If we had been hasty and had used our original sketch for the construction of the part of the graph corresponding to negative x (Figs. 1 and 2), then it would have had a “kink” (corner) at x = 0. There is no such kink in the accurate graph; instead there is a smooth “dome.”
If the values of some function corresponding to any two values of the argument equa...
Table of contents
Cover
Title
Copyrights
Foreword
Contents
Introduction
Chapter 1: Examples
Chapter 2: The Linear Function
Chapter 3: The Function Y = X
Chapter 4: The Quadratic Trinomial
Chapter 5: The Linear Fractional Function
Chapter 6: Power Functions
Chapter 7: Rational Functions
Problems for Independent Solution
Answers and Hints to Problems and Exercises Marked by the Sign ⊕
Frequently asked questions
Yes, you can cancel anytime from the Subscription tab in your account settings on the Perlego website. Your subscription will stay active until the end of your current billing period. Learn how to cancel your subscription
No, books cannot be downloaded as external files, such as PDFs, for use outside of Perlego. However, you can download books within the Perlego app for offline reading on mobile or tablet. Learn how to download books offline
Perlego offers two plans: Essential and Complete
Essential is ideal for learners and professionals who enjoy exploring a wide range of subjects. Access the Essential Library with 800,000+ trusted titles and best-sellers across business, personal growth, and the humanities. Includes unlimited reading time and Standard Read Aloud voice.
Complete: Perfect for advanced learners and researchers needing full, unrestricted access. Unlock 1.5M+ books across hundreds of subjects, including academic and specialized titles. The Complete Plan also includes advanced features like Premium Read Aloud and Research Assistant.
Both plans are available with monthly, semester, or annual billing cycles.
We are an online textbook subscription service, where you can get access to an entire online library for less than the price of a single book per month. With over 1.5 million books across 990+ topics, we’ve got you covered! Learn about our mission
Look out for the read-aloud symbol on your next book to see if you can listen to it. The read-aloud tool reads text aloud for you, highlighting the text as it is being read. You can pause it, speed it up and slow it down. Learn more about Read Aloud
Yes! You can use the Perlego app on both iOS and Android devices to read anytime, anywhere — even offline. Perfect for commutes or when you’re on the go. Please note we cannot support devices running on iOS 13 and Android 7 or earlier. Learn more about using the app
Yes, you can access Functions and Graphs by I. M. Gelfand,E. G. Glagoleva,E. E. Shnol in PDF and/or ePUB format, as well as other popular books in Mathematics & Mathematics General. We have over 1.5 million books available in our catalogue for you to explore.