eBook - ePub
Quantitative Zoology
Revised Edition
- 454 pages
- English
- ePUB (mobile friendly)
- Available on iOS & Android
eBook - ePub
Quantitative Zoology
Revised Edition
About this book
This classic focuses on the gathering, handling, and interpretation of numerical data from zoological investigations. Contents include types and properties of numerical data, mensuration, frequency distributions and grouping, patterns of frequency distributions, measures of central tendency, measures of dispersion and variability, populations and samples, and probability. "Excellent." — Florida Scientist.
Trusted by 375,005 students
Access to over 1 million titles for a fair monthly price.
Study more efficiently using our study tools.
Information
CHAPTER ONE
Types and Properties of Numerical Data
Variables in Zoology
Zoology is concerned with the study of things, of whatever sort, that vary in nature and that are in any way related to animal morphology, physiology, or behavior. Thus, when a zoologist sets out to describe or discuss any animal, he almost inevitably finds that he is using some numbers. Usually, measurements of the dimensions of individual animals are given; the proportions of the different parts of the animal are considered; different animals are compared as to size and proportions; abundance or scarcity of a species may be mentioned; the number of teeth, scales, fin rays, vertebrae, and the like are recorded. In many other ways, essentially numerical facts and deductions enter into the work. Commonly these observations are expressed by actual numbers, but not infrequently they may be expressed in words, without the use of figures. When it is said that one species is larger than another, that a given animal is abundant in a certain area, or that a certain mammal lacks canine teeth, for instance, this is only a verbal expression of a numerical idea. If such observations can be reduced to concrete figures, the expressions will usually be more accurate and more succinct. Even if they cannot well be expressed except in words, the essentially numerical nature of the concepts demands recognition and requires knowledge of the properties of numbers and of the ways in which they should be used and understood.
Because variables are not alike in their properties, a clear distinction must be made among the sorts of quantities with which the zoologist deals, in order that they may be treated intelligently.
The basic distinction to be made is that between continuous variables and discontinuous, or discrete, variables. While other categorizations of variables are possible, it is this dichotomy that is logically and operationally of greatest significance.
Continuous variables are those which can take any value in a given interval. The three basic physical units—time, length, and mass—are clearly continuous variables. Moreover, all continuous variables in zoology, or indeed in any descriptions of the real world, are expressible in one of these units or in some combination of them. It is obvious that no matter how close together two points in time are, there is some point which lies between them. There is, in fact, an infinity of values between any two points in a continuum, and it is this property which distinguishes continuous variables.
Discrete (or discontinuous) variables, on the other hand, take only certain values, so that it is possible to find two points in a discrete series between which no other value exists. The integers form such a discrete series: there is no integer, for example, between 5 and 6 or between 107 and 108. This immediately suggests that a common discrete variable in zoology is an enumeration of the number of objects in a given situation. Thus 4, 5, and 6 eggs in a clutch are values in a discrete series since, presumably, 4.367 or 5.237 are not allowable values. Nearly all discrete variables in zoology take on integral values only, since for the most part they are counts of objects ; but they are not exclusively so. Thus, degrees of genetic relationship among members of a family take values such as 1/2, 1/4, 1/8, 1/16, etc., with no intermediate steps. What is important in considering discrete variables is not whether they actually are restricted to integral values, but that there are no intermediate values between any two consecutive steps.
The distinction between kinds of variables has been made in terms of numerical values, but there are also variables in zoology, such as color, shape, and behavior, that are not numerically expressed, either because it is inconvenient and unnecessary to do so or because suitable techniques are not available. Such variables are by their nature discrete, although they may represent series which are, in fact, continuous. Thus, the division of animals into “large,” “medium,” and “small” or “dark” and “light” represents the conversion of continuous variables into discontinuous ones by including a range of values within one class. Furthermore, there are some non-numerical variables which cannot be considered as representations of numerical ones. For example, an aperture may be described as “round,” “triangular,” or “square”; the coiling of a gastropod shell may be either “dextral” or “sinistral”; a structure may be “present” or “absent.” Such descriptive variables which do not have values falling in some logical order from smallest to largest, as do numbers, are termed “attributes.” Although they are nonnumerical, they share with discrete numerical variables the property that the various classes may be assigned arbitrary integral values —that is, they may be enumerated. Variables, whether continuous or discontinuous, which take on numerical values are termed “variates” to distinguish them from “attributes.”
The existence of nonnumerical variables poses a constant problem in zoology, or indeed in any science. To begin with, there is a tendency to reduce numerical observations to nonnumerical valuations. The substitution of description such as “larger than,” “heavier than,” “older than” for actual measurement is, for the most part, unwarranted. Only in special cases should this qualitative representation be used in place of actual quantities.
Second, there is the possibility of assigning arbitrary numerical values or “scores” to variables which are not directly measurable. Unless the particular situation imposes some obvious order on these nonnumerical variables, the assignment of scores is not advisable. Very few operations which are performable on scored data cannot just as easily be applied to the primary class designations. It must be remembered that assigning numerical scores to nonnumerical classes is simply a renaming of these classes; it cannot create numerical accuracy where none exists.
There are, however, some problems which are most easily treated by numerical scores. A case of this type is discussed on page 14. Our intention is not to dismiss scores as totally useless, but rather to caution against their indiscriminate use.
Finally, there is the possibility of accurately quantifying variables which have formerly been given only qualitative treatment. Colors, which are usually considered to be nonnumerical attributes, can be described in terms of their wave length and intensities in a perfectly rigorous numerical way by the use of appropriate measuring devices. While such precision is not always necessary, it is generally desirable to treat basically numerical concepts as numerical rather than to sacrifice information and precision.
There is nothing to be gained, however, in quantifying a variable such as color when there is a clear and unambiguous distinction among the various observed classes. The distinction between black and white or between red and green is sufficiently obvious to require no further numerical precision. The distinction among various shades of grey, on the other hand, especially if there is an imperceptible gradation of shade, does require some numerical specification to make the character a useful one. Dice (1933), for example, has made extensive use of the tint photometer for the study of pelage coloration in Peromyscus. With this technique it is possible to assign numerical values to the intensity of red, yellow, green, blue, and violet coloration in the pelages of each specimen.
While it is true that variables may be continuous or discrete, in practice all measurements are discrete variables. This is so because of the real limitations of accuracy inherent in any measuring device. Electronic instruments exist which will measure time in millionths of a second (microseconds), but there is still an infinity of intervals between 1 and 2 microseconds, let us say, which are unmeasurable. No length can be measured with perfect accuracy, nor can any mass.
The degree to which measurements may approximate continuity depends, of course, upon the fineness with which the units of measurement can be subdivided. The distinction between continuous and discrete variables is useful in practice only to the extent that truly continuous variables, like length, are measured with sufficient fineness to give to the observed values some semblance of continuity. If organisms vary between 1 and 3 inches in length, a measurement to the nearest inch cannot be regarded as a value of a continuous variate, for it would provide only three distinguishable classes.
The Meaning of Numbers in Zoology
When it is said that a bird lays clutches of 4 eggs each, or that its eggs are 4 centimeters long, the number 4 is being used in two quite different and not interchangeable ways. In the first instance the number 4 is a count of discrete objects; it means that there were 4 such objects, neither more nor less. It is exactly accurate. Saying that an object is 4 cm. long, however, is only an inaccurate representation of the object’s true length, which is, of course, impossible to measure exactly. It is necessary, then, that some convention be established regarding the range of values of a continuous variate which is implied in a given measurement. The convention which is universally accepted, although often misused or misunderstood, is:
1. The observed value is the midpoint of the implied range of this measurement of the variate.
2. The range is equal in length to the smallest unit specified in the measurement.
Thus an observed measurement of 4 cm. means that the true value of the variate lies between the limits 3.5000 . . . and 4.4999 . . .. Notice that the upper limit of the implied range is not 4.5000 . . . , for if this were the case, a true value of 4.5000 . . . could be signified by 4 or 5, the implied ranges of both of these numbers having the point 4.5000 in common. The correct definition of the range avoids such ambiguity.
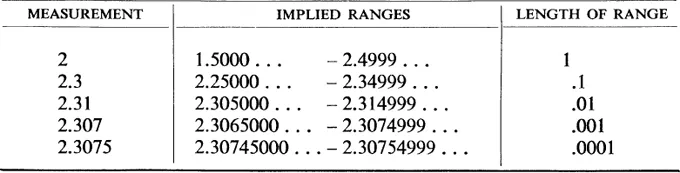
In the same way, a measurement of 4.0 cm. implies a range of true values between 3.95000 . . . and 4.04999 The numbers 4 and 4.0 are not equivalent in meaning, the addition of a zero in the first decimal place indicating a refinement of accuracy. Example 1 shows a series of progressively more accurate measurements of a true value assumed to be 2.3074999 . . . , together with the implied range of each and the length of that range.
In dealing with discrete variates, the problem of implied range does not exist. To say that there are 4 eggs in a clutch means precisely that. To be consistent in the treatment of measurements of continuous variates, it would be necessary to write 4.000 . . . eggs, indicating that this number is accurate to an infinite number of decimal places. Such a usage would be cumbersome and is never observed. Nevertheless, the expression “4 cm.” with its implied range of 3.5000 . . . – 4.4999 . . . and the expression “4 eggs” which implies 4.000 . . . must always be distinguished in practice.
EXAMPLE 1.
Increasingly accurate measurements of a true value of 2.3074999 . . . with their implied ranges.
Significant Figures
In the record of any numerical value, significant figures are, strictly speaking, those digits that are accurate—that is, the last digit is correct within a half step and thus implies a range within which the exact value lies. In a broader sense, one digit beyond these may be considered significant if it is nearer to the exact value than would be the limit of the range implied by the preceding digit.
As we have shown, the number actually recorded as the value of a continuous variate is only a symbol implying a range in which the actual value is known to lie. If, for example, a variate obtained by measurement or calculation is known to be within the range 1.5000 . . . – 2.4999 . . . , it is wrong to record the measurement as 2.0, for that symbol implies a range 1.95000 . . . – 2.04999 . . . . The information at hand does not show the true value to lie within this much shorter range (although, in fact, it may). The problem of significant figures, then, is one of assuring that the recorded symbol implies the range actually established from the available information. Thus, in the preceding example, the correct symbol is 2 and not 2.0. The 2 is a significant figure, but the .0 is not.
The first consideration in the quantitative treatment of variables is that of the number of significant figures used in recording observations.
Accuracy of measurement depends on the nature of the material, the equipment used in measuring, and personal factors such as bias and consistency (reliability), which are discussed in a following section. The degree of accuracy obtained under given circumstances can be determined experimentally. For example, one of the present authors made a measurement of tooth length, as is routine in vertebrate paleontology, using a low-power binocular microscope and a caliper calibrated to. 1 mm. He repeated the operation on five consecutive days. The results were as follows:

Expressed in integral millimeters, these measurements are all 13, while in tenths of a millimeter they range from 12.9 to 13.3, averaging 13.1. From the distribution of these measurements and other criteria extraneous here, it was certain that the exact value was somewhere in the range of 13.0—13.2. All the measurements are thus accurate to two figures (13), for that implied range 12.5000 . . . – 13.4999 . . . certainly includes the true value. They are not accurate to three figures (one decimal place), for no single one of these more refined figures certainly includes the true value, and two of them (12.9, 13.3) certainly do not. This is nevertheless a case in which records to three figures, one inaccurate, are preferable to the accurate two-figure measurements. All the three-place figures, even the most divergent, are closer to the exact value than are the limits 12.5000 . . .–13.4999 . . . implied by the two-place figure 13. As a general criterion, inaccurate figures are useful if their range of error is less than the implied range of the accurate figures available.
The smallest of six measurements made in this experiment is certainly 98 per cent or more of the exact value and the largest 102 per cent or less. It is thus certain that any one measurement was within 2 per cent of the real value of the dimension measured. Supposing, as other experiments show to be highly probable, that this represents the degree of accuracy generally obtainable with such equipment and with little or no personal bias, it is possible to work out a schedule such as the following:
Between .2 and 2, use two decimal places (.20–1.99)
Between 2 and 20, use one decimal place (2.0–19.9)
Between 20 and 200, use units (20–199)
Etc.
Another expression of the same rule is: under the given or similar conditions of material and technique, record three digits if the first is 1, and otherwise record only two. In practice this means that a record of a tooth as being 15 mm. in length is, for practical ...
Table of contents
- Cover
- Title Page
- Copyright Page
- Contents
- Preface
- Preface to the Dover Edition
- 1 Types and Properties of Numerical Data
- 2 Mensuration
- 3 Frequency Distributions and Grouping
- 4 Patterns of Frequency Distributions
- 5 Measures of Central Tendency
- 6 Measures of Dispersion and Variability
- 7 Populations and Samples
- 8 Probability and Probability Distributions
- 9 Confidence Intervals
- 10 Comparisons of Samples
- 11 Correlation and Regression
- 12 The Analysis of Variance
- 13 Tests on Frequencies
- 14 Graphic Methods
- 15 Growth
- Appendix Tables
- Symbols
- Bibliography
- Index
Frequently asked questions
Yes, you can cancel anytime from the Subscription tab in your account settings on the Perlego website. Your subscription will stay active until the end of your current billing period. Learn how to cancel your subscription
No, books cannot be downloaded as external files, such as PDFs, for use outside of Perlego. However, you can download books within the Perlego app for offline reading on mobile or tablet. Learn how to download books offline
Perlego offers two plans: Essential and Complete
- Essential is ideal for learners and professionals who enjoy exploring a wide range of subjects. Access the Essential Library with 800,000+ trusted titles and best-sellers across business, personal growth, and the humanities. Includes unlimited reading time and Standard Read Aloud voice.
- Complete: Perfect for advanced learners and researchers needing full, unrestricted access. Unlock 1.4M+ books across hundreds of subjects, including academic and specialized titles. The Complete Plan also includes advanced features like Premium Read Aloud and Research Assistant.
We are an online textbook subscription service, where you can get access to an entire online library for less than the price of a single book per month. With over 1 million books across 990+ topics, we’ve got you covered! Learn about our mission
Look out for the read-aloud symbol on your next book to see if you can listen to it. The read-aloud tool reads text aloud for you, highlighting the text as it is being read. You can pause it, speed it up and slow it down. Learn more about Read Aloud
Yes! You can use the Perlego app on both iOS and Android devices to read anytime, anywhere — even offline. Perfect for commutes or when you’re on the go.
Please note we cannot support devices running on iOS 13 and Android 7 or earlier. Learn more about using the app
Please note we cannot support devices running on iOS 13 and Android 7 or earlier. Learn more about using the app
Yes, you can access Quantitative Zoology by George Gaylord Simpson,Anne Roe,Richard C. Lewontin, Anne Roe, Richard C. Lewontin in PDF and/or ePUB format, as well as other popular books in Biological Sciences & Biology. We have over one million books available in our catalogue for you to explore.