Winner of the Bruno Kreisky Prize, Karl Renner Institut
A Financial Times Best Economics Book of the Year
An Economist Best Book of the Year
A Livemint Best Book of the Year
One of the world's leading economists of inequality, Branko Milanovic presents a bold new account of the dynamics that drive inequality on a global scale. Drawing on vast data sets and cutting-edge research, he explains the benign and malign forces that make inequality rise and fall within and among nations. He also reveals who has been helped the most by globalization, who has been held back, and what policies might tilt the balance toward economic justice.
"The data [Milanovic] provides offer a clearer picture of great economic puzzles, and his bold theorizing chips away at tired economic orthodoxies."
—The Economist
"Milanovic has written an outstanding book…Informative, wide-ranging, scholarly, imaginative and commendably brief. As you would expect from one of the world's leading experts on this topic, Milanovic has added significantly to important recent works by Thomas Piketty, Anthony Atkinson and François Bourguignon…Ever-rising inequality looks a highly unlikely combination with any genuine democracy. It is to the credit of Milanovic's book that it brings out these dangers so clearly, along with the important global successes of the past few decades.
—Martin Wolf, Financial Times
- 299 pages
- English
- ePUB (mobile friendly)
- Available on iOS & Android
eBook - ePub
About this book
Trusted by 375,005 students
Access to over 1.5 million titles for a fair monthly price.
Study more efficiently using our study tools.
Information
1
The Rise of the Global Middle Class and Global Plutocrats
Intercourse between nations spans the whole globe to such an extent that one may almost say all the world is but a single city in which a permanent fair comprising all commodities is held, so that by means of money all the things produced by the land, animals and human industry can be acquired and enjoyed by any person in his own home.
—GEMINIANO MONTANARI (1683)
Who Has Gained from Globalization?
The gains from globalization are not evenly distributed.
Figure 1.1 shows this phenomenon in a stark way. By plotting percentage gain in income against the original income, we can see which income groups have gained the most in the past few decades. The horizontal axis shows the percentiles of the global income distribution, ranging from the poorest people in the world on the left to the richest (the “global top 1 percent”) on the extreme right. (People are ranked by after-tax household per capita income expressed in dollars of equal purchasing power; for details of how income comparisons between countries are made, see Excursus 1.1.)1 The vertical axis shows the cumulative growth in real income (income adjusted for inflation and differences in price levels between the countries) between 1988 and 2008. This twenty-year period coincides almost exactly with the years from the fall of the Berlin Wall to the global financial crisis. It covers the period that may be called “high globalization,” an era that has brought into the ambit of the interdependent world economy first China, with a population of more than one billion people, and then the centrally planned economies of the Soviet Union and Eastern Europe, with about half a billion people. Even India can be included, since, with the reforms in the early 1990s, its economy has become more closely integrated with the rest of the world. This period also saw the communications revolution, which allowed firms to relocate factories to distant countries where they could take advantage of cheap labor without relinquishing control. There was thus a double coincidence of “peripheral” markets opening up and core countries being able to hire labor from these peripheral countries in situ. In many respects, the years just before the financial crisis were the most globalized years in human history.2
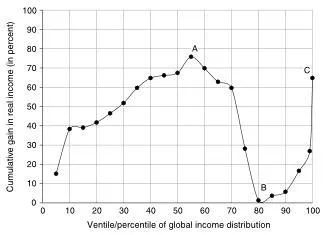
FIGURE 1.1. Relative gain in real per capita income by global income level, 1988–2008
This graph shows relative (percentage) gain in real household per capita income (measured in 2005 international dollars) between 1988 and 2008 at different points of the global income distribution (ranging from the poorest global ventile, at 5, to the richest global percentile, at 100). Real income gains were greatest among people around the 50th percentile of the global income distribution (the median; at point A) and among the richest (the top 1%; at point C). They were lowest among people who were around the 80th percentile globally (point B), most of whom are in the lower middle class of the rich world. Data source: Lakner and Milanovic (2015).
EXCURSUS 1.1. Where Do the Data for Global Income Distributions Come From?
There is no global household survey of individual incomes in the world. The only way to create a global income distribution is to combine as many national household surveys as possible. Such household surveys select a random sample of households and ask a number of questions on demographics (age, gender, and other characteristics of respondents) and location (where the household lives, including what province, whether in a rural or urban area, and so on), and, for our purposes the most important, questions about the sources and amounts of household income and consumption. Income data include wages, self-employment income, income from ownership of assets (interest, dividends, rental of property), income from production for the household’s own consumption (very common in poorer and less monetized economies where households produce their own food), social transfers (government-provided pensions, unemployment benefits), and income deductions such as direct taxes. Consumption data cover money spent on everything from food and housing to entertainment and restaurant services.
Household surveys are the only source of such individualized, detailed information on incomes and expenditures that cover the entire distribution, from the very poor to the very rich. By contrast, data from fiscal sources, such as tax records, generally include only the households of better-off people, that is, those paying income taxes. There are many such households in the United States, but very few in India. Thus, fiscal data cannot be used to generate a worldwide distribution of income.
The size of household surveys varies. Some are large because the country is large: the Indian National Sample Survey includes more than 100,000 households, or more than half a million individuals; the US Current Population Survey includes more than 200,000 individuals. Many surveys are small, with about 10,000–15,000 people. Such survey data, while never easily available, have recently become more accessible to researchers. For example, in the 1970s and 1980s, not only did relatively few countries conduct surveys, but it was very rare that researchers could get access to “microdata” (that is, individual household data, anonymized to preserve confidentiality). Income distributions were estimated using the government-published fractiles of income recipients (e.g., so many households with incomes between $x and $y). More recently, with greater openness of statistical offices and improvements in the processing of large data sets, almost all data, with the notable exception of China, are available at the micro level. This presents significant advantages to researchers: they can redefine income or consumption so as to be comparable across countries or produce inequality measures that are based on households, individuals, or what are called “equivalent units” (adjusting for the fact that larger households enjoy some economies of scale; that is, they do not need a proportional increase in income to be as well-off as smaller households). None of these adjustments is possible without access to the microdata.
The main sources of such microdata are the Luxembourg Income Study (LIS), which includes harmonized survey data (i.e., definitions of income variables that are made as comparable as possible between the countries), mostly from rich countries; the World Bank, which has extensive country coverage and makes some surveys available to outside researchers while other data are available only to World Bank staff; the Social and Economic Database for Latin America and the Caribbean (SEDLAC), located at Universidad de la Plata in Buenos Aires; and the Economic and Research Forum (ERF), located in Cairo, which includes surveys from the Middle East. All of these sources can be easily found on the Internet, but often access to the microdata is restricted to noncommercial uses and “bona fide” researchers, or access is difficult because of the need to know how to download massive databases and apply statistical programs. In addition, for a number of countries (e.g., India, Indonesia, and Thailand), although the data can be accessed directly from statistical offices, that process requires clearance and long waiting periods. So while access to data is becoming much better, it is still not easy. It is also important to realize that even if all the data were suddenly to become easily accessible, factors such as the sheer size of the files, complicated definitions of the variables, and comparability issues mean that income distribution data would never be as simple to use as much more aggregated statistics like Gross National Product.
Now, if each country were to conduct such surveys annually, we could, by collating them, obtain annual estimates of global income distribution. Only rich and middle-income countries have regular annual surveys, however, and even among these countries, annual surveys are something of a novelty. And in many poor countries, especially in Africa, household surveys are done at irregular intervals, on average every three or four years. There are also numerous countries that do surveys only at very long intervals, either because they have no money or technical expertise to field them or because they are at war, civil or foreign. This is the reason why global data can be put together only at approximately five-year intervals (as in this chapter) and are centered around one year, called the “benchmark year,” which includes surveys from that year and one or two surrounding years.
National household surveys represent the first building block for determining the global income distribution. The second building block is conversion of such income or consumption data from local currencies into a global currency that should in principle have the same purchasing power everywhere. Why is this important? Because to assess people’s incomes and make them comparable, we have to allow for the fact that price levels differ between countries. Thus, to express the real standard of living of people who live in very different environments (countries), not only do we need to convert their incomes into a single currency, but we also have to account for the fact that poorer countries generally have lower price levels. Put in simpler terms, it is less costly to attain a given standard of living in a poorer than in a richer country: ten dollars will buy more food in India than in Norway. This second building block relies on an exercise called the International Comparison Project (ICP) that is conducted at irregular intervals (the last three rounds were done in 1993, 2005, and 2011) and whose objective is to collect price data in all countries of the world and to use these data to calculate countries’ price levels.
The ICP is the single most massive empirical exercise ever conducted in economics. Its final products are the so-called PPP (purchasing power parity) exchange rates. The PPP exchange rate is the exchange rate between, say, the US dollar and the Indian rupee, such that at that exchange rate a person could buy the same amount of goods and services in India as in the United States. To give an example, consider the results for 2011. The market exchange rate was 46 Indian rupees for 1 US dollar. But the estimated PPP exchange rate was 15 rupees per dollar. In other words, if you lived in India, you needed only 15 rupees to buy the same amount of goods and services as a person living in the United States could have bought with 1 dollar. The reason why you needed only 15 rupees (and not 46) is because the price level in India was lower; we can say that it was about one-third (15/46) of the US price level.
It is by applying these PPP exchange rates to the incomes from national household surveys that incomes are converted into PPP (or international) dollars and made comparable across countries. This conversion then enables us to calculate global income distribution. We can see, then, that global income distribution is impossible to calculate without two enormous empirical exercises: hundreds of national household surveys, and individual price data that are aggregated into national price indexes.
However, such massive exercises have their own problems. For household surveys, the most important problem is the imperfect inclusion of people at both ends of the income distribution: the very poor and the very rich. The very poor are omitted because household surveys choose households randomly based on place of residence. Homeless people and institutionalized populations (soldiers, prisoners, and students or workers who live in dormitories) are thus not included, and these people are generally poor. At the other end of the spectrum, the rich tend to underreport their incomes (especially their income from property) and, more alarmingly for researchers analyzing income data, sometimes refuse to participate in surveys altogether. The effect of such refusals on income distribution is difficult to prove directly (because one obviously does not know the income of a household that has refused to be interviewed) but can be estimated from where those who refuse to participate live. It has been estimated that US income inequality might be underestimated by as much as 10 percent because of such nonparticipation (Mistiaen and Ravallion 2006).
These problems are similar or even more serious in other countries and are reflected in two discrepancies between household surveys and macrodata: first, income and consumption reported from household surveys do not fully match household private income and consumption calculated from national accounts (that is, from GDP calculations), and second, statistical discrepancies (called errors and omissions) occur in balance of payments data because of, among other things, money transferred to tax havens (see Zucman 2013, 2015), which, for obvious reasons, is unlikely to be reported in surveys. It is therefore safe to say that household surveys underestimate the number of people who are poor (whatever the definition of poverty) and the number of people who are rich, and their incomes. Lakner and Milanovic (2013) try to adjust globally for the latter, but any such adjustment, while useful, contains a very large degree of arbitrar...
Table of contents
- Cover
- Title Page
- Copyright
- Contents
- Acknowledgments
- Introduction
- 1. The Rise of the Global Middle Class and Global Plutocrats
- 2. Inequality within Countries: Introducing Kuznets Waves to Explain Long-Term Trends in Inequality
- 3. Inequality among Countries: From Karl Marx to Frantz Fanon, and Then Back to Marx?
- 4. Global Inequality in This Century and the Next
- 5. What Next?: Ten Short Reflections on the Future of Income Inequality and Globalization
- Notes
- References
- Index
Frequently asked questions
Yes, you can cancel anytime from the Subscription tab in your account settings on the Perlego website. Your subscription will stay active until the end of your current billing period. Learn how to cancel your subscription
No, books cannot be downloaded as external files, such as PDFs, for use outside of Perlego. However, you can download books within the Perlego app for offline reading on mobile or tablet. Learn how to download books offline
Perlego offers two plans: Essential and Complete
- Essential is ideal for learners and professionals who enjoy exploring a wide range of subjects. Access the Essential Library with 800,000+ trusted titles and best-sellers across business, personal growth, and the humanities. Includes unlimited reading time and Standard Read Aloud voice.
- Complete: Perfect for advanced learners and researchers needing full, unrestricted access. Unlock 1.5M+ books across hundreds of subjects, including academic and specialized titles. The Complete Plan also includes advanced features like Premium Read Aloud and Research Assistant.
We are an online textbook subscription service, where you can get access to an entire online library for less than the price of a single book per month. With over 1.5 million books across 990+ topics, we’ve got you covered! Learn about our mission
Look out for the read-aloud symbol on your next book to see if you can listen to it. The read-aloud tool reads text aloud for you, highlighting the text as it is being read. You can pause it, speed it up and slow it down. Learn more about Read Aloud
Yes! You can use the Perlego app on both iOS and Android devices to read anytime, anywhere — even offline. Perfect for commutes or when you’re on the go.
Please note we cannot support devices running on iOS 13 and Android 7 or earlier. Learn more about using the app
Please note we cannot support devices running on iOS 13 and Android 7 or earlier. Learn more about using the app
Yes, you can access Global Inequality by Branko Milanovic in PDF and/or ePUB format, as well as other popular books in Economics & Development Economics. We have over 1.5 million books available in our catalogue for you to explore.