This is not a book. It is a one-of-a-kind immersive learning experience through which you can become—or teach others to be—a powerful data storyteller.
Let's practice! helps you build confidence and credibility to create graphs and visualizations that make sense and weave them into action-inspiring stories. Expanding upon best seller storytelling with data 's foundational lessons, Let's practice! delivers fresh content, a plethora of new examples, and over 100 hands-on exercises. Author and data storytelling maven Cole Nussbaumer Knaflic guides you along the path to hone core skills and become a well-practiced data communicator. Each chapter includes:
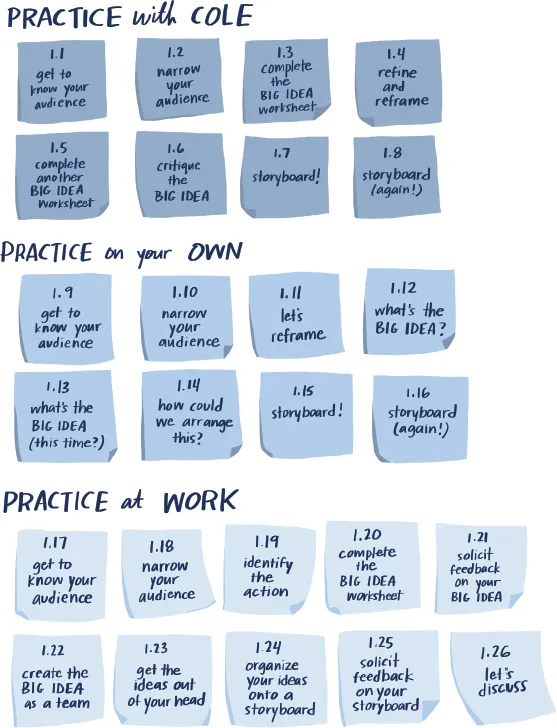
? Practice with Cole: exercises based on real-world examples first posed for you to consider and solve, followed by detailed step-by-step illustration and explanation
? Practice on your own: thought-provoking questions and even more exercises to be assigned or worked through individually, without prescribed solutions
? Practice at work: practical guidance and hands-on exercises for applying storytelling with data lessons on the job, including instruction on when and how to solicit useful feedback and refine for greater impact
The lessons and exercises found within this comprehensive guide will empower you to master—or develop in others—data storytelling skills and transition your work from acceptable to exceptional. By investing in these skills for ourselves and our teams, we can all tell inspiring and influential data stories!
Trusted by 375,005 students
Access to over 1.5 million titles for a fair monthly price.
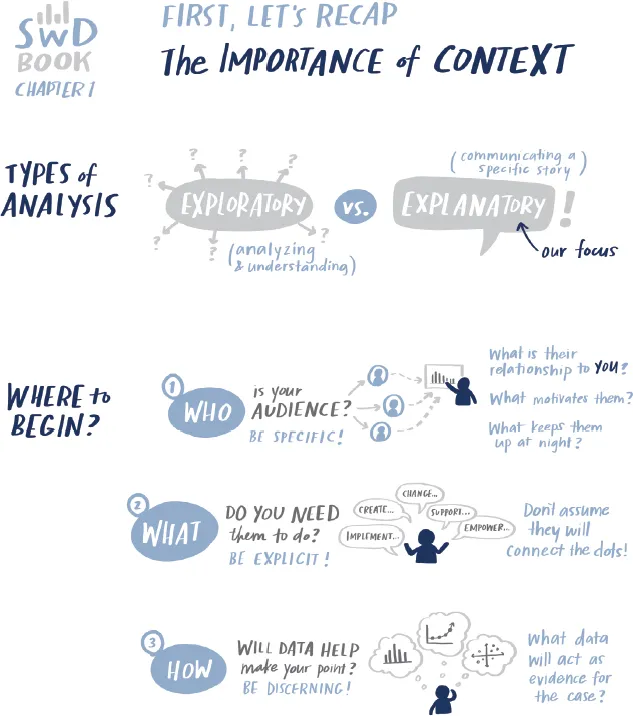
A little planning can go a long way and lead to more concise and effective communications. In our workshops, I find that we allocate an increasing amount of time and discussion on the very first lesson we cover, which focuses on context. People come in thinking they want data visualization best practices and are surprised by the amount of time we spend on—and that they want to spend on—topics related more generally to how we plan for our communications. By thinking about our audience, message, and components of content up front (and getting feedback at this early stage), we put ourselves in a better position for creating graphs, presentations or other data-backed materials that will meet our audience’s needs and our own.
The exercises in this chapter focus primarily on three important aspects of the planning process:
Considering our audience: identifying who they are, what they care about, and how we can better get to know them and design our communications with them in mind.
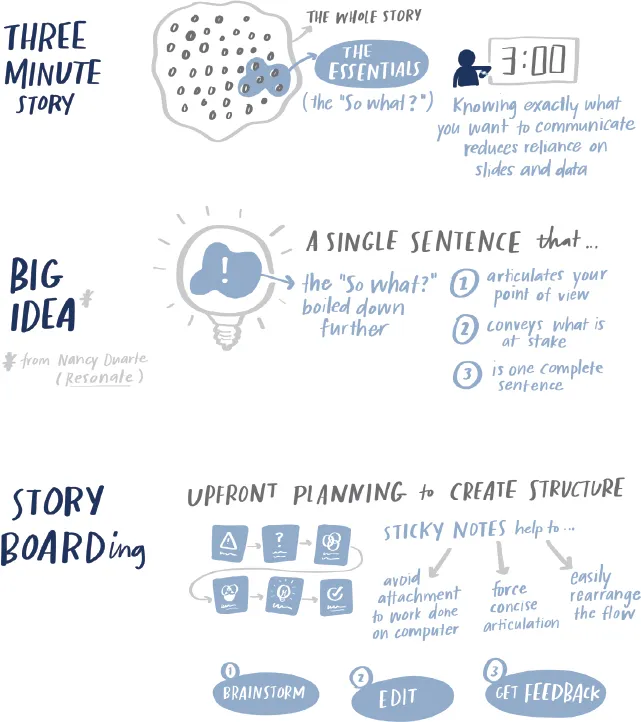
Crafting and refining our main message: the Big Idea was introduced briefly in SWD; here, we’ll undertake a number of guided and independent exercises to better understand and practice this important concept.
Planning content: storyboarding is another concept that was introduced in SWD—we’ll look at a number of additional examples and exercises related to what we include and how we organize it.
Let’s practice understanding the context!
First, we’ll review the main lessons from SWDChapter 1.
Exercise 1.1: get to know your audience
Who is my audience? What do they care about? These may seem like obvious questions to ask ourselves when we step back and think about it, but too often we completely skip this step. Getting to know our audience and understanding their needs and what drives them is an important early part of the process for successfully communicating with data.
Let’s examine what this looks like in the wild and how we can get to know a new audience.
Imagine you work as a People Analyst (a data analyst within the Human Resources, or HR, function) at a medium-sized company. A new head of HR has just joined the organization (she is now your boss’s boss). You’ve been asked to pull together an overview with data to help the freshly hired head of HR get up to speed with the different parts of the business from a people standpoint. This will include things like interview and hiring metrics, a headcount review across different parts of the organization, and attrition data (how many are leaving and why they are leaving). Some of your colleagues in other groups within HR have already had meet-and-greets with the new leader and given their respective synopses. Your direct manager recently had lunch with the new head of HR.
How could you get to better know your audience (the new head of HR) in this circumstance? List three things you could do to understand your audience, what she cares about, and how to best address her needs. Be specific in terms of what questions you would seek to answer. Get out your pen and paper and physically write down your responses.
Solution 1.1: get to know your audience
Since this isn’t likely a case where we can ask our audience directly what she cares about, we’ll need to get a little creative. Here are three things I could do to set myself up for success when it comes to better understanding my audience and what matters to her most:
Set up time to get a debrief from colleagues who have already met with the new leader. Talk to those who have had conversations with the new head of HR. How did those discussions go? Do they have any insight on this new leader’s priorities or points of interest? Is there anything that didn’t go well from which you can learn and adapt?
Talk to my manager to get insight. My manager has lunched with the new leader: what insight did he get about potential first points of focus? I also need to understand what my manager sees as important to focus on in this initial meeting.
Use my understanding of the data and context plus some thoughtful design to structure the document. Given that I’ve been working in this space for a while, I have a big picture understanding of the different main topics that someone new to our organization will assumably be interested in and the data we can use to inform. If I’m strategic in how I structure the document, I can make it easy to navigate and meet a wide variety of potential needs. I can provide an overview with the high level takeaways up front. Then I can organize the rest of the document by topic so the new leader can quickly turn to and get more detail on the areas that most interest her.
Exercise 1.2: narrow your audience
There is tremendous value in having a specific audience in mind when we communicate. Yet, often, we find ourselves facing a wide or mixed audience. By trying to meet the needs of many, we don’t meet any specific need as directly or effectively as we could if we narrowed our focus and target audience. This doesn’t mean that we don’t still communicate to a mixed audience, but having a specific audience in mind first and foremost means we put ourselves in a better position to meet that core audience’s needs.
Let’s practice the process of narrowing for purposes of communicating. We’ll start by casting a wide net and then employ various strategies to focus from there. Work your way through the questions and write out how you would address them. Then read the following pages to better understand various strategies for narrowing our audience.
You work at a national clothing retailer. You’ve conducted a survey asking your customers and the customers of your competitors about various elements related to back-to-school shopping. You’ve analyzed the data. You’ve found there are some areas where your company is performing well, and also some other areas of opportunity. You’re nearing the point of communicating your findings.
QUESTION 1: There are a lot of different groups of people (at your company and potentially beyond) who could be interested in this data. Who might care how your stores performed in the recent back-to-school shopping season? Cast as wide of a net as possible. How many different audiences can you come up with who might be interested in the survey data you’ve analyzed? Make a list!
QUESTION 2: Let’s get...
Table of contents
Cover
Title Page
Copyright
acknowledgments
about the author
introduction
chapter one understand the context
chapter two choose an effective visual
chapter three identify & eliminate clutter
chapter four focus attention
chapter five think like a designer
chapter six tell a story
chapter seven practice more with cole
chapter eight practice more on your own
chapter nine practice more at work
chapter ten closing words
index
End User License Agreement
Frequently asked questions
Yes, you can cancel anytime from the Subscription tab in your account settings on the Perlego website. Your subscription will stay active until the end of your current billing period. Learn how to cancel your subscription
No, books cannot be downloaded as external files, such as PDFs, for use outside of Perlego. However, you can download books within the Perlego app for offline reading on mobile or tablet. Learn how to download books offline
Perlego offers two plans: Essential and Complete
Essential is ideal for learners and professionals who enjoy exploring a wide range of subjects. Access the Essential Library with 800,000+ trusted titles and best-sellers across business, personal growth, and the humanities. Includes unlimited reading time and Standard Read Aloud voice.
Complete: Perfect for advanced learners and researchers needing full, unrestricted access. Unlock 1.5M+ books across hundreds of subjects, including academic and specialized titles. The Complete Plan also includes advanced features like Premium Read Aloud and Research Assistant.
Both plans are available with monthly, semester, or annual billing cycles.
We are an online textbook subscription service, where you can get access to an entire online library for less than the price of a single book per month. With over 1.5 million books across 990+ topics, we’ve got you covered! Learn about our mission
Look out for the read-aloud symbol on your next book to see if you can listen to it. The read-aloud tool reads text aloud for you, highlighting the text as it is being read. You can pause it, speed it up and slow it down. Learn more about Read Aloud
Yes! You can use the Perlego app on both iOS and Android devices to read anytime, anywhere — even offline. Perfect for commutes or when you’re on the go. Please note we cannot support devices running on iOS 13 and Android 7 or earlier. Learn more about using the app
Yes, you can access Storytelling with Data by Cole Nussbaumer Knaflic in PDF and/or ePUB format, as well as other popular books in Computer Science & Meetings & Presentations. We have over 1.5 million books available in our catalogue for you to explore.